Data Analysis Plugins
Data analysis plugins are found in the plugin tray, accessed via the plugin icon in the upper right corner of the Specviz application window. Each plugin may be used to perform data analysis tasks on selected datasets.
Input/Output
Data to be operated on are selected in each plugin via a Data pulldown menu.
Gaussian Smooth
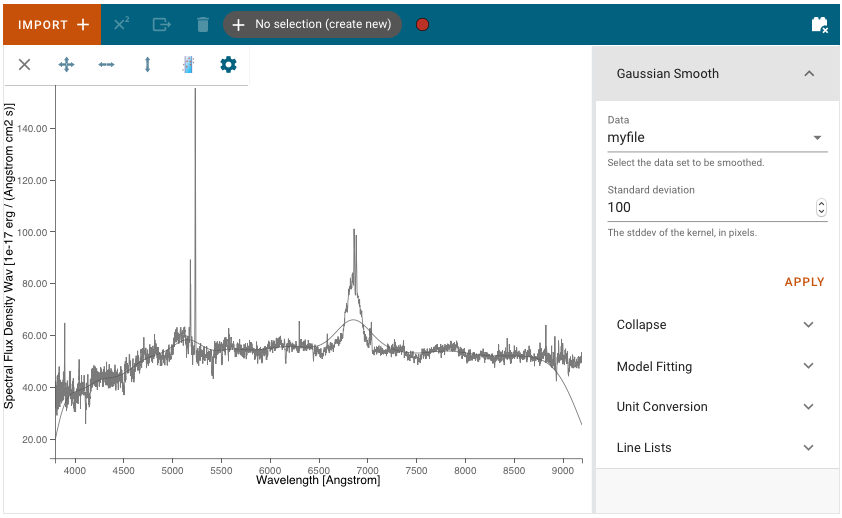
Gaussian Smooth is performed on a Spectrum1D data object. The spectrum is convolved with a Gaussian function. The Gaussian standard deviation in pixels must be entered into the Standard deviation field in the plugin.
A new Spectrum1D object is generated and is added to the spectrum viewer. It can be selected and shown in the viewer via the gear–>Data tab.
Model Fitting
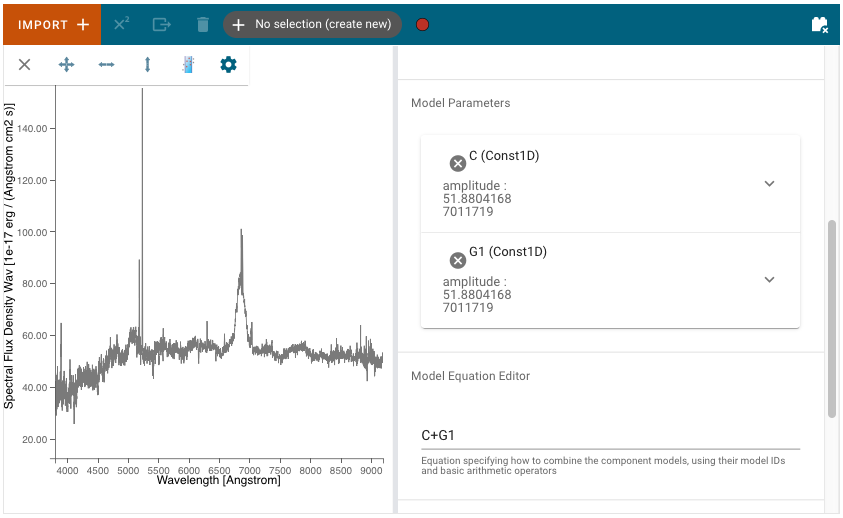
Astropy models can be fit to a spectrum via the Model Fitting plugin. Model components are selected via the Model pulldown menu. Each component should be given a Model ID. The Add Model button adds a Model Parameters block.
Model Parameters are automatically initialized with a guess. These starting values can be edited by the user. They may also be fixed by selecting the Fixed? checkbox, so that they are not fit or changed by the model fitting.
A mathematical expression must be entered into the Model Equation Editor to specify the mathematical combination of models. This is also necessary even if there is only one model component. The model components are specified by their Model ID. For example, add together Constant and Gaussian models with model IDs ‘C’ and ‘G1’ by entering the Model Equation ‘C+G1’.
Unit Conversion
The spectral flux density and spectral axis units can be converted using the Unit Conversion plugin. The Spectrum1D object to be converted is selected in the spectrum viewer gear–>Data tab. It is not currently possible to select the data within the Plugin.
Select the frequency, wavelength, or energy unit in the New Spectral Axis Unit pulldown (e.g. Angstrom, Hertz, erg).
Select the flux density unit in the New Flux Unit pulldown (e.g. Jansky, W/(Hz/m2), ph/(Angstrom cm2 s)).
The Apply button will convert the flux density and/or spectral axis units and create a new Spectrum1D object that appears and can be selected in the spectrum viewer Data tab.
Line Lists
Line wavelengths can be plotted in the spectrum viewer using the Line Lists plugin.
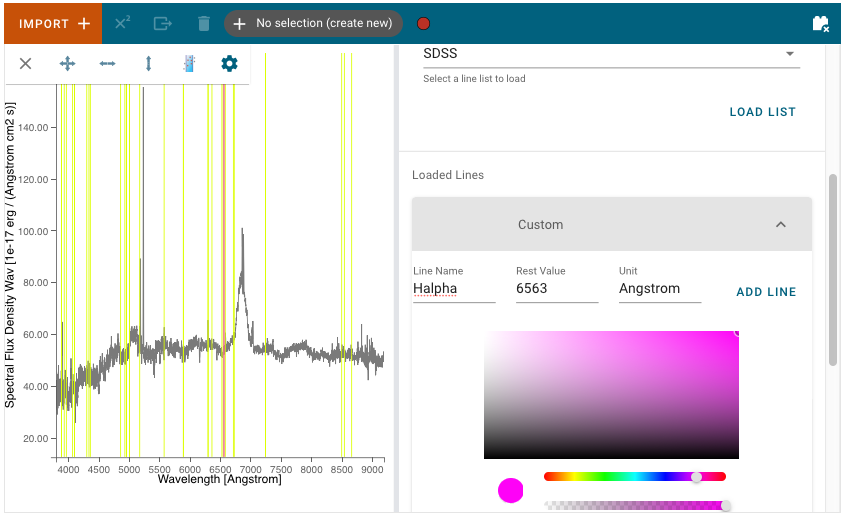
Line lists (e.g. Common Stellar, SDSS, CO) can be selected from Preset Line Lists via the Available Line Lists pulldown. They are loaded and displayed by pressing Load List. Each loaded list is shown under Loaded Lines. Loaded line lists may be removed by pressing the circled-x button.
The Loaded Lines include a Custom line list which is automatically created, but populated with no lines. Lines may be added to the Custom line list by entering Line Name, Rest Value, and Unit for the spectral axis and pressing Add Line. Selected lines may be hidden by deselecting the associated check box.
The color of each line list may be adjusted with the color and saturation sliders. Entire line lists may be hidden in the display via Show All and Hide All, located at the bottom of each list. Similarly, all of the line lists may be shown or hidden via Plot All and Erase All, located at the bottom of the plugin.
Line Analysis
The Line Analysis plugin returns statistics for a single emission line. The emission line is selected via the region tool in the spectrum viewer to select a spectral subset.
The statistics returned include the line centroid, gaussian sigma width, gaussian FWHM, total flux, and equivalent width.
Currently, it is assumed that the continuum has already been normalized to unity. The line statistics may be incorrect for a spectrum with a non-unity continuum. Future versions will include a method to specify and normalize the continuum.