 Specviz#

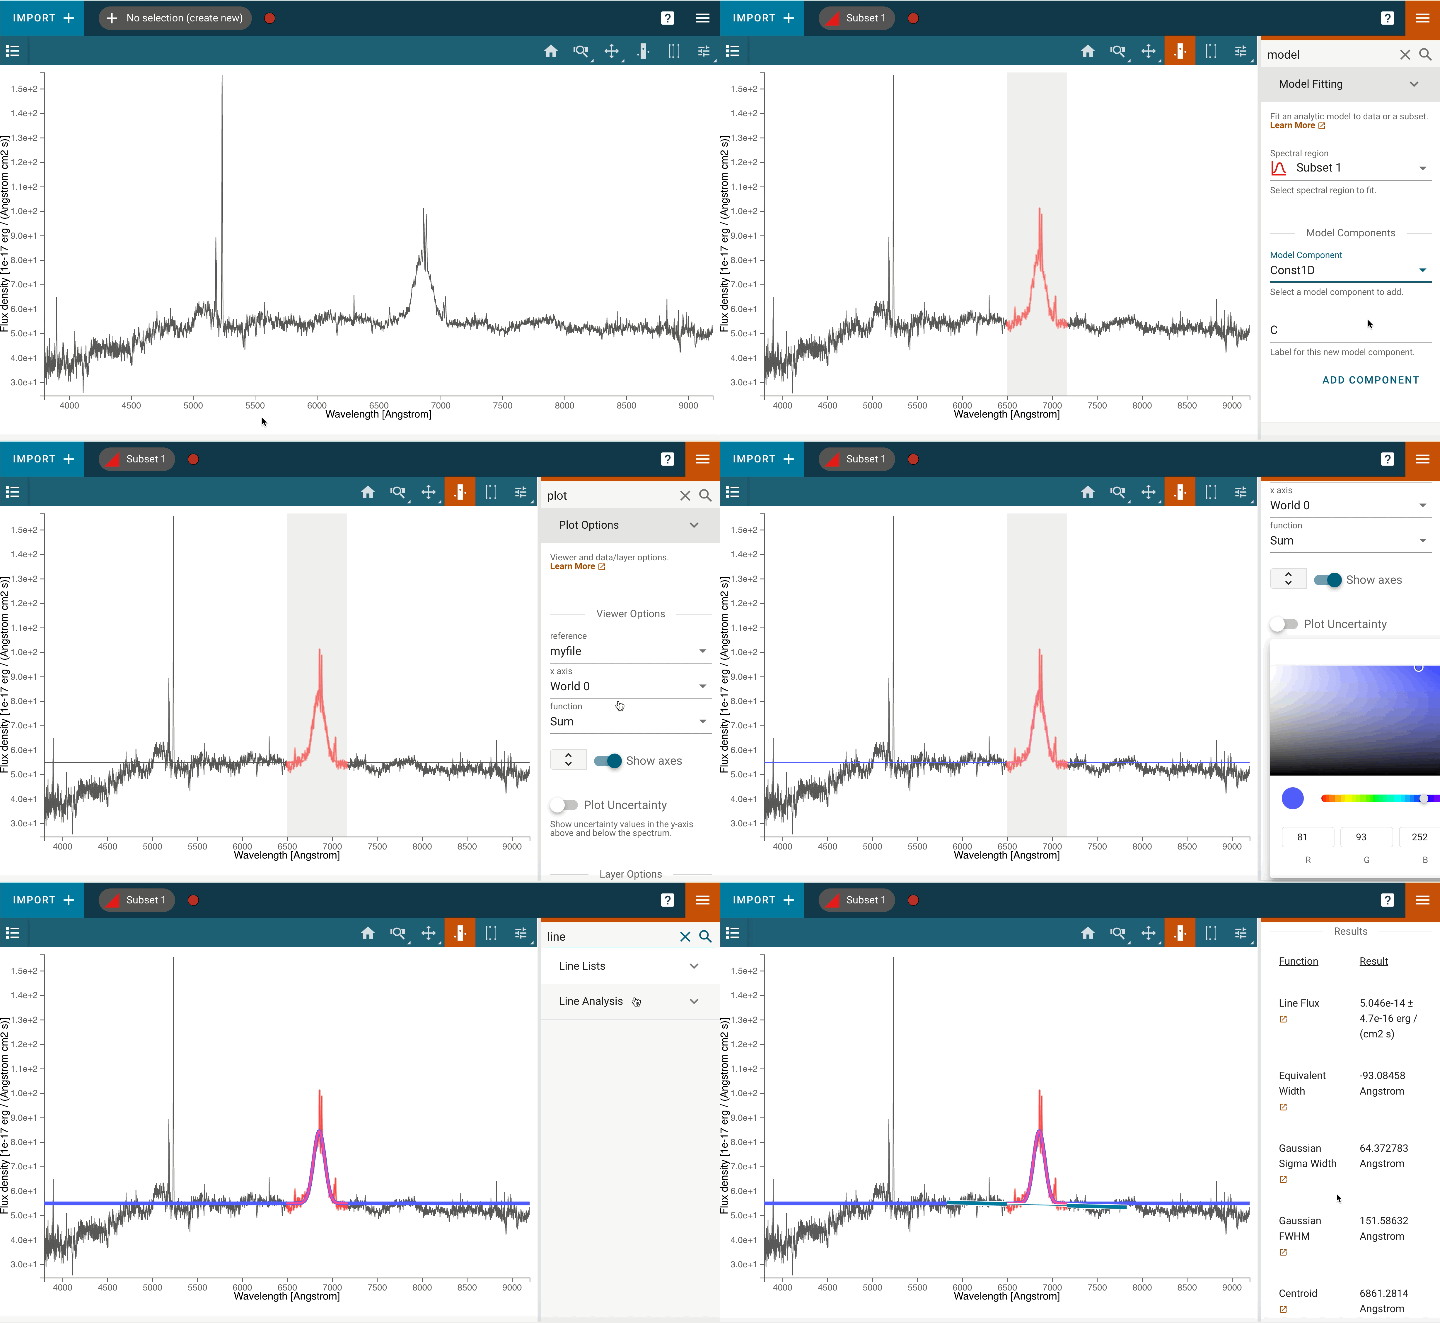
Specviz is a tool for visualization and quick-look analysis of 1D astronomical spectra. It incorporates visualization tools with analysis capabilities, such as Astropy regions and specutils packages. Users can interact with their data from within the tool.
Specviz allows spectra to be easily plotted and examined. It supports flexible spectral unit conversions, custom plotting attributes, interactive selections, multiple plots, and other features. Specviz notably includes a measurement tool for spectral lines which enables the user, with a few mouse actions, to perform and record measurements. It has a model fitting capability that enables the user to create simple (e.g., single Gaussian) or multi-component models (e.g., multiple Gaussians for emission and absorption lines in addition to regions of flat continua).
A typical data-analysis workflow might involve data exploration using Specviz and then scripting to create more complex measurements or modeling workflows using specutils. Data can be both imported into and exported out of the tool so users can continue their desired workflow within the notebook. This documentation provides details on its various capabilities alongside demo videos and example notebooks.
Using Specviz