Displaying Cubes
The Cubeviz layout includes three image viewers (at the top of the app)
and one spectrum viewer (at the bottom of the app), which it attempts to
populate automatically when the first dataset is loaded. By default, cubeviz
attempts to parse and display the flux in the top left viewer, the uncertainty
in the top middle viewer, and the mask into the top right viewer. The spectrum
viewer is populated by default by collapsing the spatial axes using the max
function. The indicators that the load machinery looks for in each HDU to
populate the viewers are below (note that in all cases, header values are
converted to lower case):
Flux viewer:
hdu.nameis in the set['flux', 'sci']Uncertainty viewer:
hdu.header.keys()includes “errtype” orhdu.nameis in the set['ivar', 'err', 'var', 'uncert']Mask viewer:
hdu.data.dtypeisnp.int,np.uintornp.uint32, orhdu.nameis in the set['mask', 'dq']
If any viewer fails to populate automatically, or if displaying different data is desired, the user can manually select data for each viewer as described in the next section. Different statistics for collapsing the spectrum displayed in the spectrum viewer can be chosen as described in Display Settings. Note that any spatial subsets will also be collapsed into a spectrum using the same statistic and displayed in the spectrum viewer along with the spectrum resulting from collapsing all the data in each spectral slice.
Selecting Data Set
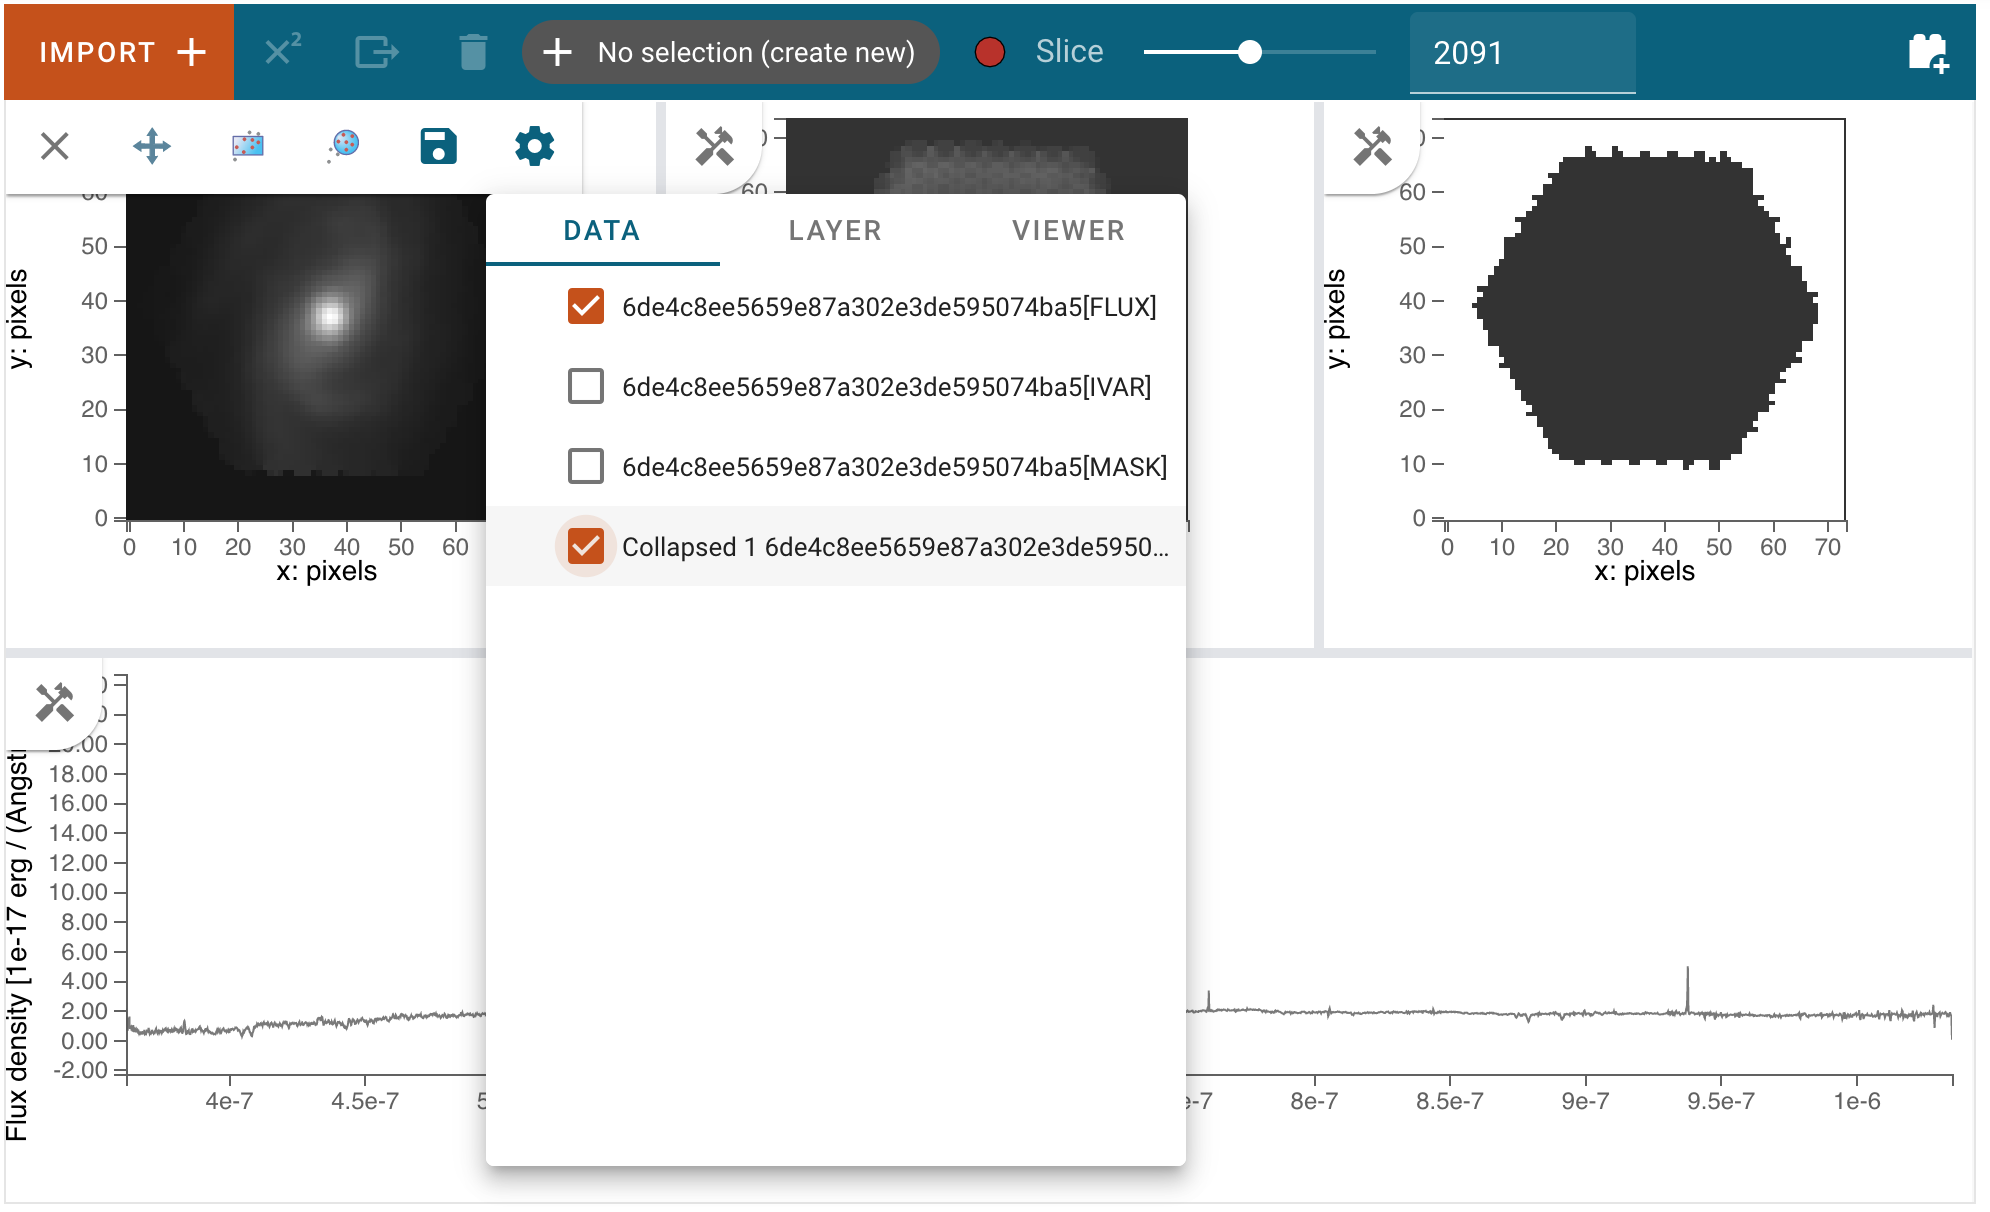
The data to be displayed in each viewer can be selected and de-selected by clicking on the hammer and screwdriver icon at the top left of each viewer. Then, click the gear icon to access the Data tab. Here, you can click the checkbox next to each listed dataset to make that dataset visible (checked) or invisible (unchecked).
Changing Wavelength Slice
To change the wavelength slice, click and drag the slider at the top of the Cubeviz User Interface (UI) to the left or right in order to get a lower or higher slice number, respectively. Another option is to click the circle that controls the location on the slider and use the left or right arrow keys on your keyboard to find a slice number with more precision. A third option is to type a slice number into the text box to the right of the slider and press enter on your keyboard. A fourth option is to use the up/down arrows inside the text box to raise/lower the slice number.
Defining Spatial Regions
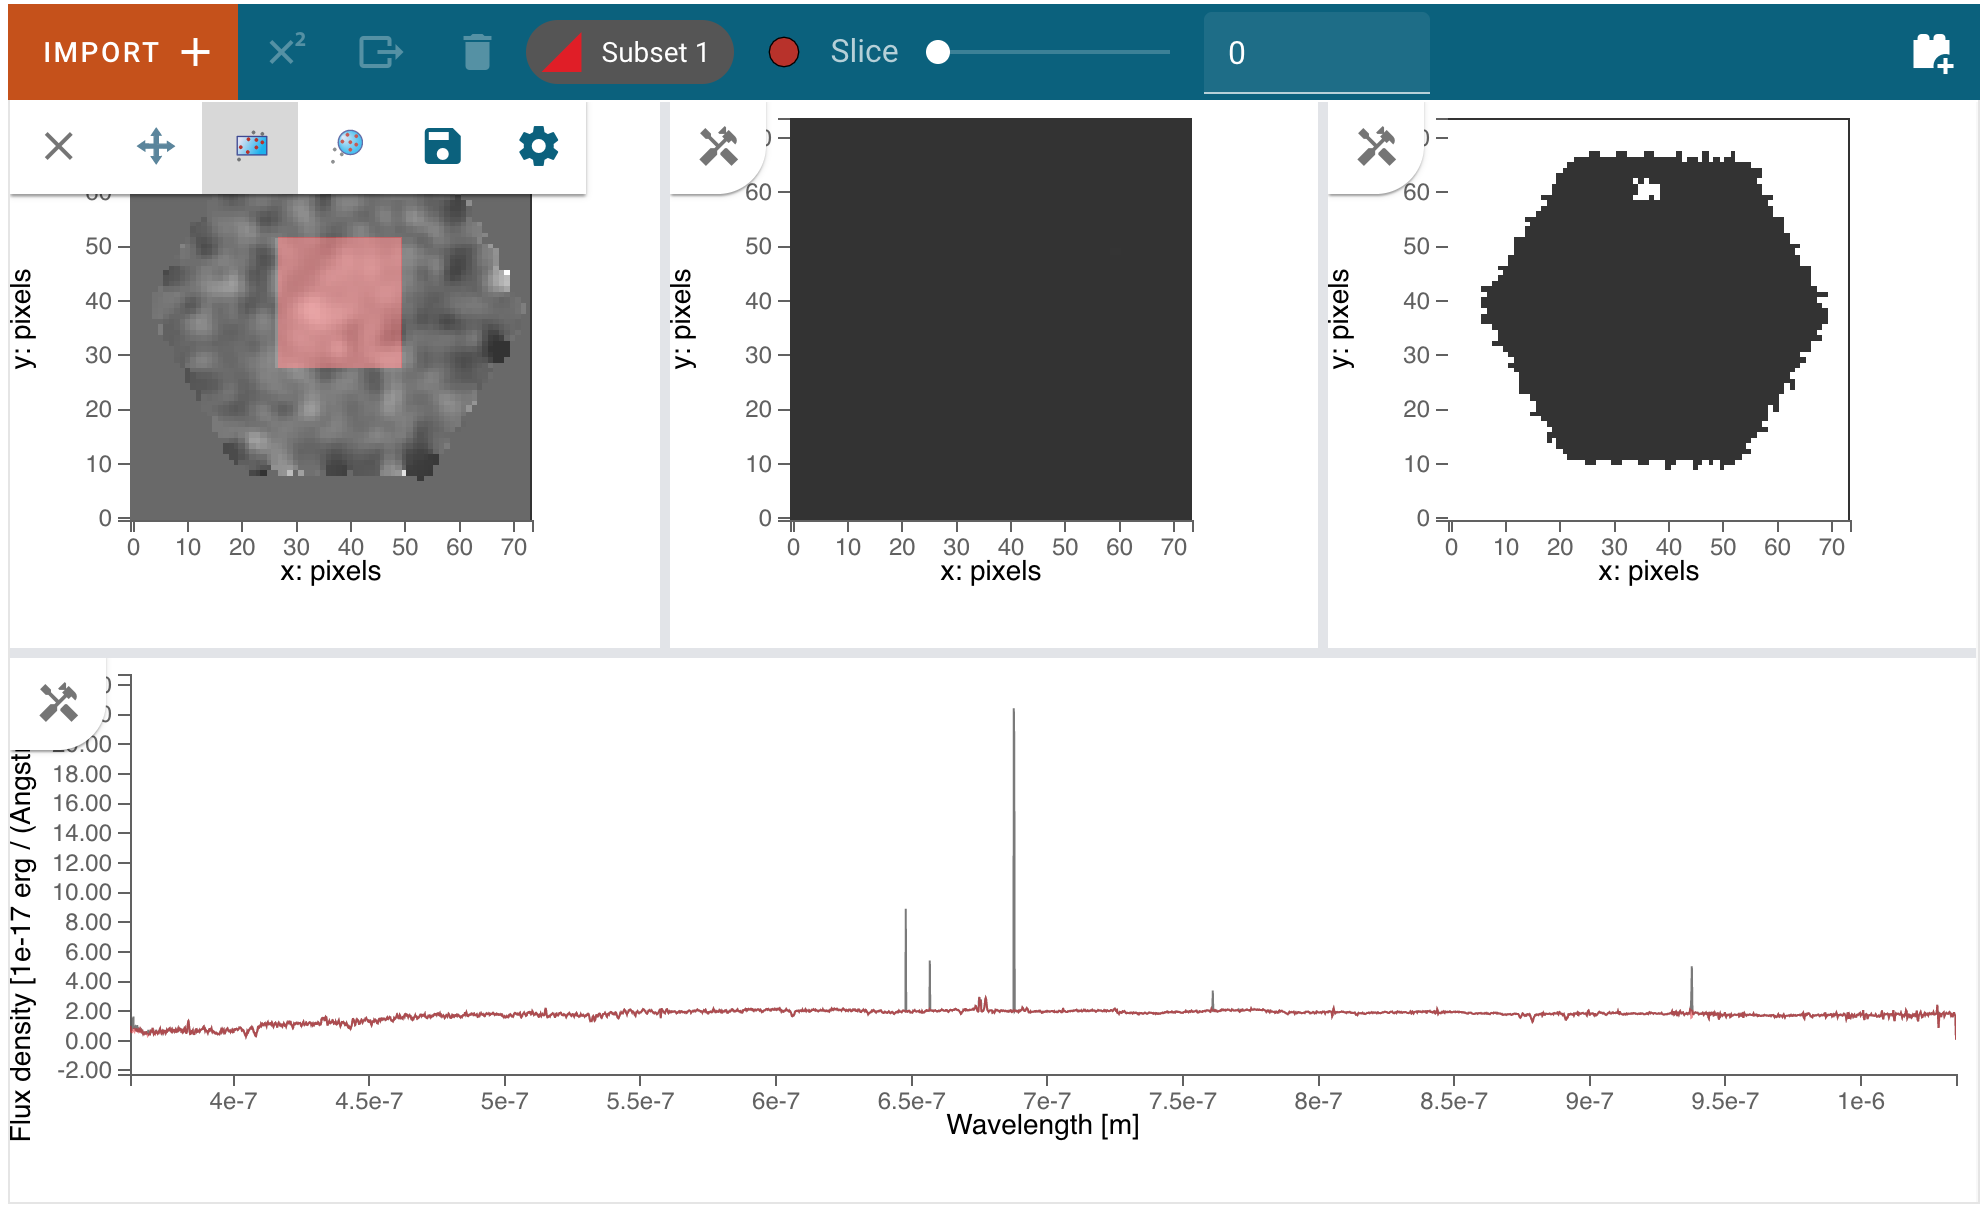
Regions can be created by first clicking the hammer and screwdriver icon and selecting either the rectangular region of interest icon or the circular region of interest icon, then clicking and dragging (using the mouse) until the desired region is covered by a colored shape, after which you release the mouse button. Once you have completed the action of clicking and dragging, there is an opportunity to reposition the region of interest by clicking on it and moving the region to a different location in the image viewer. If you are satisfied with the positioning of your region of interest, simply click another part of the viewer to lock it in place. Once a region is selected, the cube will be collapsed in wavelength space over the region, and the resulting spectrum will be displayed in the 1d spectrum viewer at the bottom of the UI.
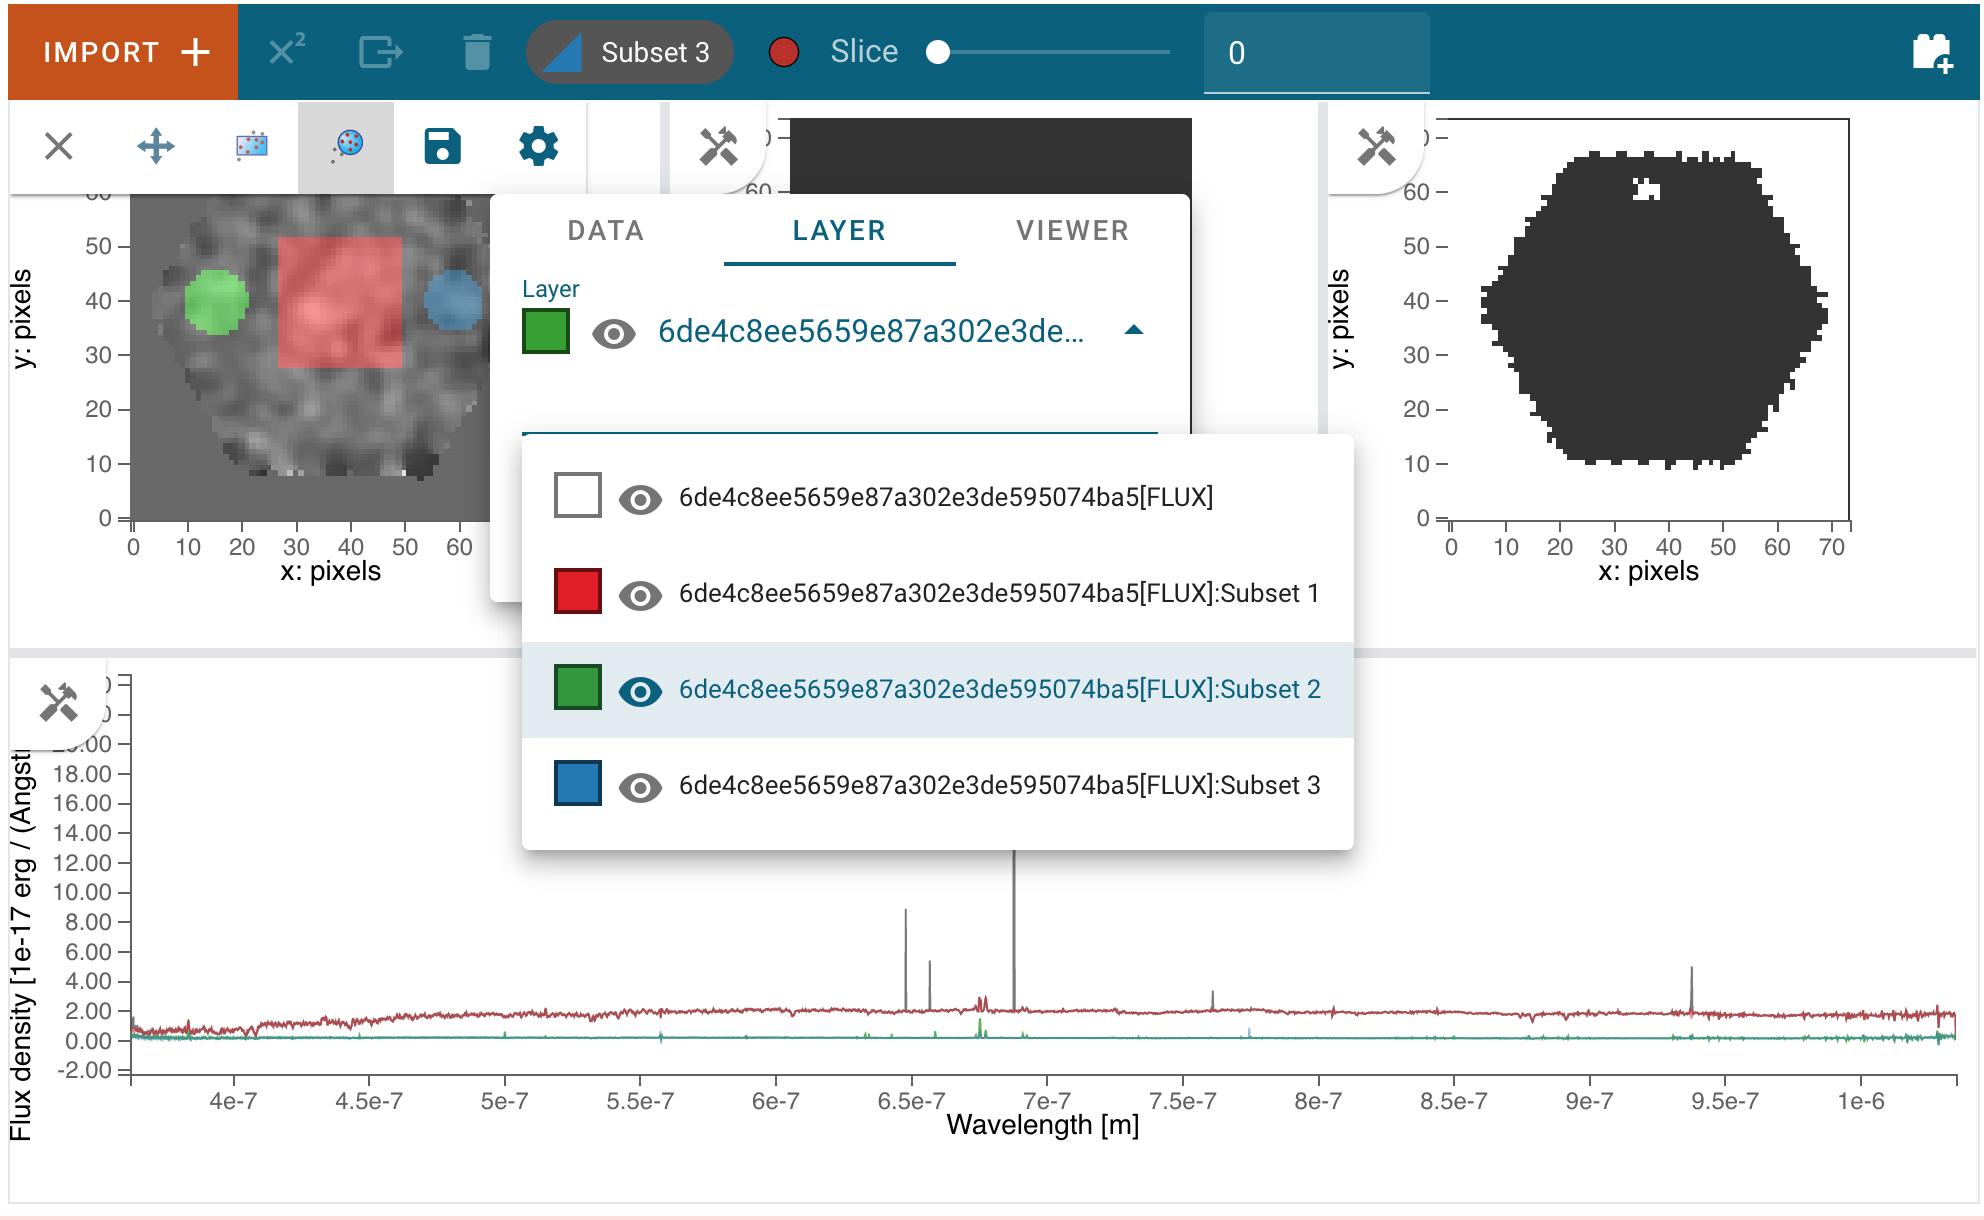
There are other options available for region of interest. At the top of the User Interface,
there is a section that says either “+ No selection (create new)” or “Subset n” where n is an integer
that tells you which Subset is currently selected. To the right of this area, are red circles that allow
you to change the method of region selection. The options are replace, add, and, xor, and remove.
replace will remove the previously created selection and place the newly created subset.
add allows you to create another subset that extends the existing subset.
and only leaves behind the overlapping region between the existing subset and any additional subsets.
xor only leaves behind the non-overlapping region between the existing subset and any additional subsets.
remove will de-select any parts of the existing subset that overlaps with any additional subsets.
You can use these options to further adjust the region of interest and adapt it to your use case.
See also
- Defining subsets using Glue
Glueviz documentation on defining and refining subsets. Slightly different UI but same approach.
There are options available in the Layer tab to make subsets visible or invisible, to change their color, and to change their opacity.
Defining Spectral Regions
Spectral regions can be defined in the spectrum viewer in the same way they are defined in Specviz.
See also
- Defining Spectral Regions (Specviz)
Documentation on defining spectral regions in a 1D spectrum viewer.
Pan/Zoom
Panning and zooming in the Cubeviz viewers works the same as described in the section on Panning and Zooming in Specviz, with the exception that image viewers have only the bidirectional Pan/Zoom tool enabled. The 1D spectrum viewer allows panning and zooming along a single axis as in Specviz.
Display Settings
To access all of the different display settings for an image viewer, click the hammer and screwdriver and go to the Layer tab. Changing the display settings DOES NOT change the underlying data, only the visualization of that data.
Layer
This option allows you to change which layer you are changing the settings for.
Attribute
This shows which extension of the data is being displayed in the current viewer.
Contour
This option selects whether to show or hide contours.
Bitmap
This option selects whether to show or hide the bitmap (image) in the viewer.
Opacity
Change the translucence of the image.
Contrast
Change the luminance of the color in the image.
Bias
Set a constant to subtract from every point in the data array before applying the conversion between data value and displayed pixel saturation. The bias slider center position is 0 bias, such that a user can apply negative bias values by sliding it left.
Stretch
Change the equation that is used to convert data values between min and max to the 0 to 1 scale of pixel saturation on the displayed image.
Percentile
Can be used to set the min and max values based on percentiles of the data.
Min
If the percentile is “custom”, then the data value corresponding to the minimum of the colormap scale (e.g. black in grayscale) can be set.
Max
If the percentile is “custom”, then the data value corresponding to the maximum of the colormap scale (e.g. white in grayscale) can be set.
Colormap
The spectrum of colors used to visualize data can be changed using this drop down.
See also
- Plot Settings (Specviz)
Plot settings for the spectrum 1D viewer.