Displaying Cubes
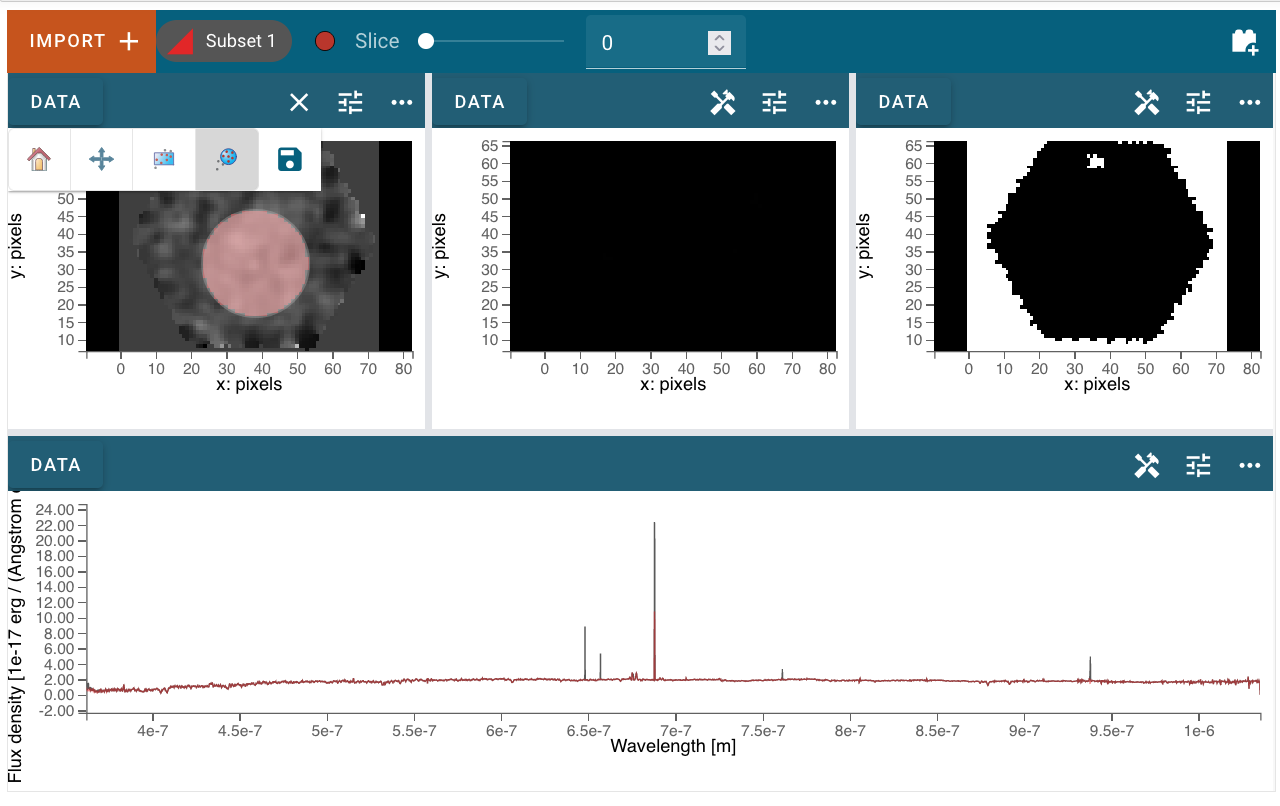
The Cubeviz layout includes three image viewers (at the top of the app)
and one spectrum viewer (at the bottom of the app), which it attempts to
populate automatically when the first dataset is loaded. By default, Cubeviz
attempts to parse and display the flux in the top left viewer, the uncertainty
in the top middle viewer, and the mask into the top right viewer. The spectrum
viewer is populated by default by collapsing the spatial axes using the max
function. The indicators that the load machinery looks for in each HDU to
populate the viewers are below (note that in all cases, header values are
converted to lower case):
Flux viewer:
hdu.nameis in the set['flux', 'sci']Uncertainty viewer:
hdu.header.keys()includes “errtype” orhdu.nameis in the set['ivar', 'err', 'var', 'uncert']Mask viewer:
hdu.data.dtypeisint,numpy.uintornumpy.uint32, orhdu.nameis in the set['mask', 'dq']
If any viewer fails to populate automatically, or if displaying different data is desired, the user can manually select data for each viewer as described in the next section. Different statistics for collapsing the spectrum displayed in the spectrum viewer can be chosen as described in Display Settings. Note that any spatial subsets will also be collapsed into a spectrum using the same statistic and displayed in the spectrum viewer along with the spectrum resulting from collapsing all the data in each spectral slice.
Much of the Cubeviz functionality can be handled within the tool or the Jupyter notebook using an API. The Toolbar below gives you several spectroscopic display options. Right click will open a dropdown with access to different options for each button.
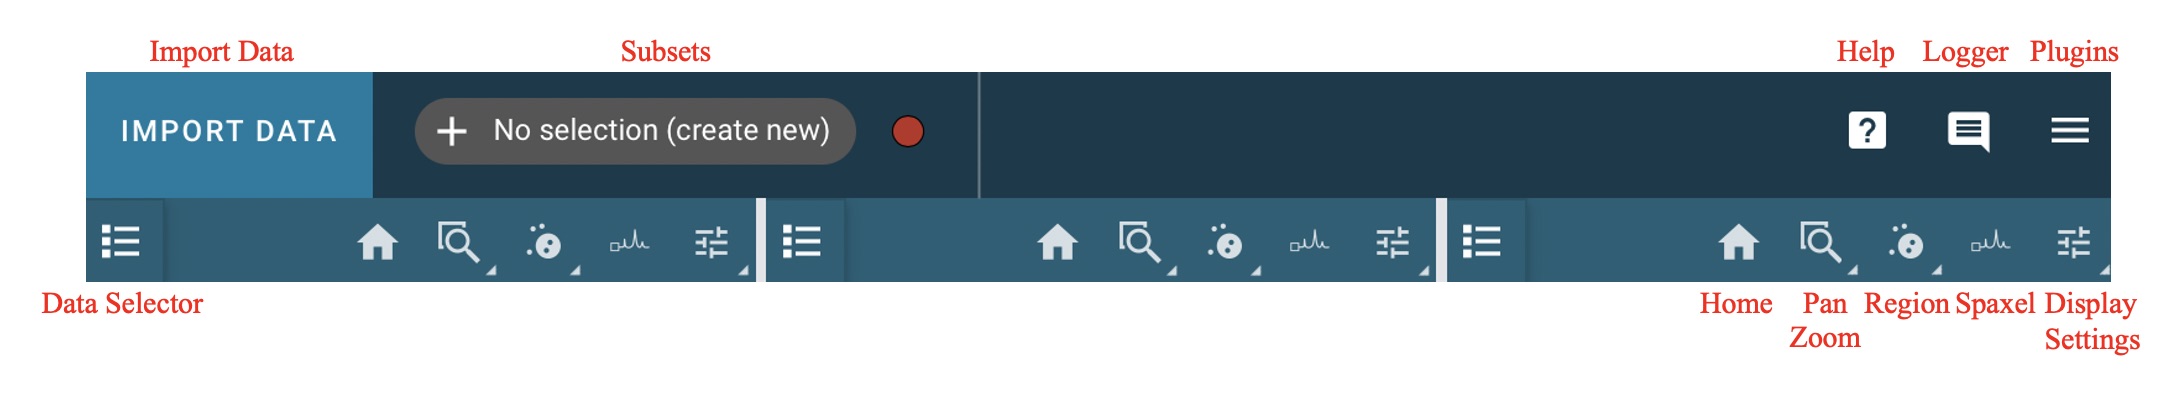
Selecting Data Set
If you have already imported data into Imviz, you can select and deselect data within a viewer.
See also
- Selecting Data Set
Documentation on selecting data sets in the Jdaviz viewers.
Home
This button will reset your zoom and panning to display the entire image.
Pan/Zoom
See also
- Pan/Zoom in Imviz
Documentation on panning and zooming in Imviz.
Defining Spatial Regions
See also
- Defining Spatial Regions
Documentation on defining spatial regions in an image viewer.
Spatial regions allow users to select subsets of the data array for specific analysis function in the plugin toolbar. Users can create spatial regions either in Imviz or the Jupyter notebook. Once a region is selected, the cube will be collapsed in wavelength space over the region, and the resulting spectrum will be displayed in the 1d spectrum viewer at the bottom of the UI.
Spectrum At Spaxel
This tool allows the user to create a one spaxel subset in an image viewer. This subset will then be visualized in the spectrum viewer by showing the spectrum at that spaxel. Users can hold down the alt key (Alt key on Windows, Option key on Mac) while clicking on a spaxel to create a new subset at that point. Users can then compare spectra at different spaxels using the spectrum viewer. Users can also utilize the different subset modes that are explained in the Spatial Regions section.
Display Settings
See also
- Display Settings
Documentation on various display settings in the jdaviz viewers.
To access all of the different display settings for an image viewer, click the
 icon in the viewer toolbar or open the Plot Options plugin.
Changing the display settings DOES NOT change the underlying data, only the
visualization of that data.
icon in the viewer toolbar or open the Plot Options plugin.
Changing the display settings DOES NOT change the underlying data, only the
visualization of that data.