Importing Data Into Specviz
By design, Specviz only supports data that can be parsed as Spectrum1D objects,
as that allows the Python-level interface and parsing tools to be defined in specutils
instead of being duplicated in Jdaviz.
Spectrum1D objects are very flexible in their capabilities, however,
and hence should address most astronomical spectrum use cases.
See also
- Reading from a File
Specutils documentation on loading data as
Spectrum1Dobjects.
Importing data through the Command Line
You can load your data into the Specviz application through the command line. Specifying a data file is optional, and multiple data files may be provided:
jdaviz specviz /my/directory/spectrum1.fits /my/directory/spectrum2.fits
Importing data through the GUI
You can load your data into the Specviz application
by clicking the Import Data button at the top left of the application’s
user interface. This opens a dialogue where the user can select a file
that can be parsed as a Spectrum1D.
After clicking Import, the data file will be parsed and loaded into the application. A notification will appear to let users know if the data import was successful. Afterward, the new data set can be found in the Data tab of each viewer’s options menu as described in Selecting a Data Set.
Importing data via the API
Alternatively, users who work in a coding environment like a Jupyter
notebook can access the Specviz helper class API. Using this API, users can
load data into the application through code with the
load_spectrum()
method, which takes as input a Spectrum1D object.
FITS Files
The example below loads a FITS file into Specviz:
from specutils import Spectrum1D
spec1d = Spectrum1D.read("/path/to/data/file")
specviz = Specviz()
specviz.load_spectrum(spec1d, data_label="my_spec")
specviz.show()
You can also pass the path to a file that Spectrum1D understands directly to the
load_spectrum() method:
specviz.load_spectrum("path/to/data/file")
Creating Your Own Array
You can create your own array to load into Specviz:
import numpy as np
import astropy.units as u
from specutils import Spectrum1D
from jdaviz import Specviz

flux = np.random.randn(200) * u.Jy
wavelength = np.arange(5100, 5300) * u.AA
spec1d = Spectrum1D(spectral_axis=wavelength, flux=flux)
specviz = Specviz()
specviz.load_spectrum(spec1d, data_label="my_spec")
specviz.show()
JWST datamodels
If you have a jwst.datamodels object, you can load it into Specviz as follows:
from specutils import Spectrum1D
from jdaviz import Specviz

# mydatamodel is a jwst.datamodels.MultiSpecModel object
a = mydatamodel.spec[0]
flux = a.spec_table['FLUX']
wave = a.spec_table['WAVELENGTH']

spec1d = Spectrum1D(flux=flux, spectral_axis=wave)
specviz = Specviz()
specviz.load_spectrum(spec1d, data_label="MultiSpecModel")
specviz.show()
There is no plan to natively load such objects until datamodels
is separated from the jwst pipeline package.
Importing a SpectrumList
The load_spectrum() also accepts
a SpectrumList object, in which case it will both load the
individual Spectrum1D objects in the list and additionally attempt
to stitch together the spectra into a single data object so that
they can be manipulated and analyzed in the application as a single entity:
from specutils import SpectrumList
spec_list = SpectrumList([spec1d_1, spec1d_2])
specviz.load_spectrum(spec_list)
specviz.show()
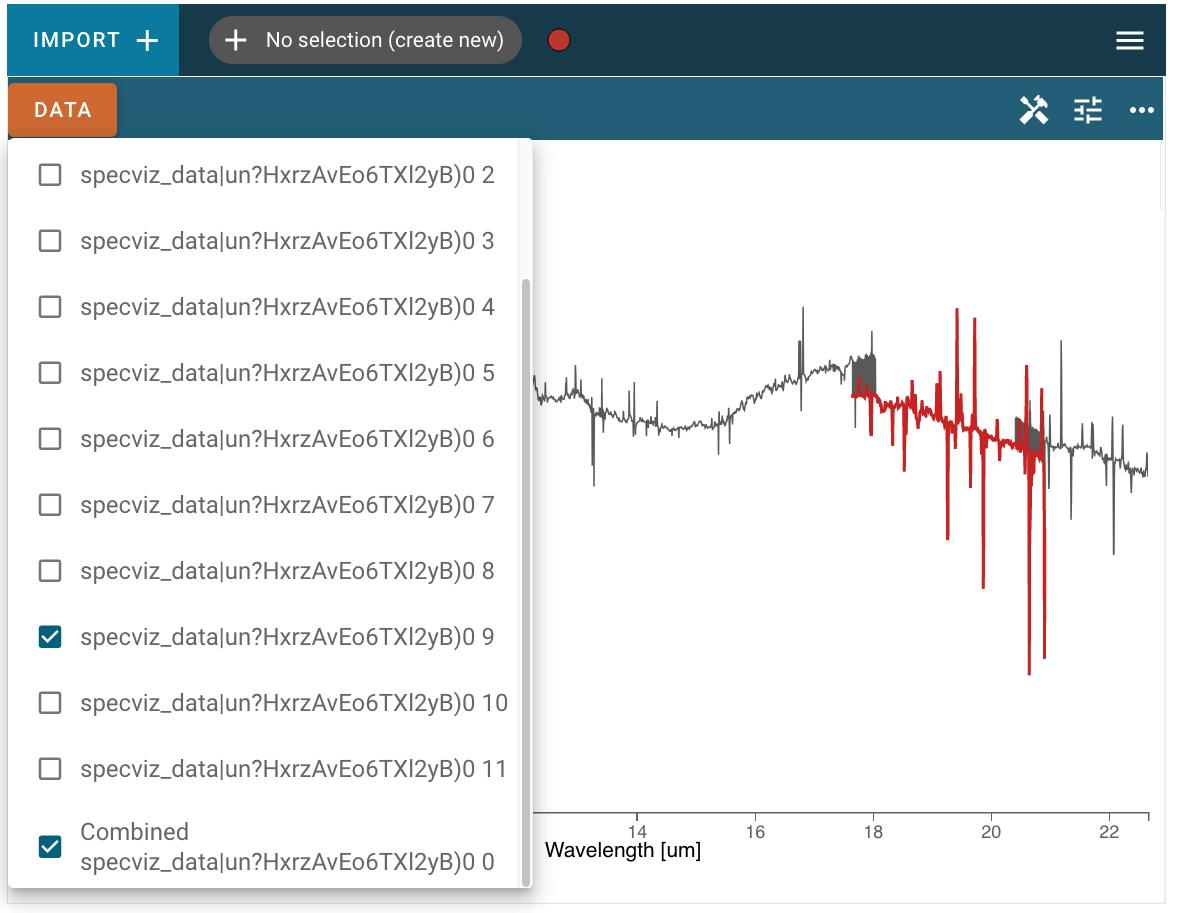
In the screenshot below, the combined spectrum is plotted in gray, and one of the single component spectra are also selected and plotted in red. Note that the “stitching” algorithm to combine the spectra is a simple concatenation of data, so in areas where the wavelength ranges of component spectra overlap you may see the line plot jumping between points of the two spectra, as at the beginning and end of the red region in the screenshot below:
This functionality is also available in limited instances by providing a directory path
to the load_spectrum() method. Note
that the read method of SpectrumList is only set up to handle
directory input in limited cases, for example JWST MIRI MRS data, and will throw an error
in other cases. In cases that it does work, only files in the directory level specified
will be read, with no recursion into deeper folders.
The load_spectrum() method also takes
an optional keyword argument concat_by_file. When set to True, the spectra
loaded in the SpectrumList will be concatenated together into one
combined spectrum per loaded file, which may be useful for MIRI observations, for example.