Data Analysis Plugins
To enable quick analysis of astronomical spectra, Specviz ships with a number of
plugins that let you do various standard spectral analysis tasks. Note that
these plugins all depend on specutils to do the actual analysis work - when
doing these operations in the Notebook you are often better off using
the specutils or astropy APIs directly instead of using the plugins. But
for quick-look or interaction heavy workflows, the plugins provide a UI-based
alternative.
Data analysis plugins are found in the plugin tray, accessed via the plugin icon in the upper right corner of the Specviz application window. Each plugin may be used to perform data analysis tasks on selected datasets.
Input/Output
Data to be operated on are selected in each plugin via a Data pulldown menu.
Gaussian Smooth
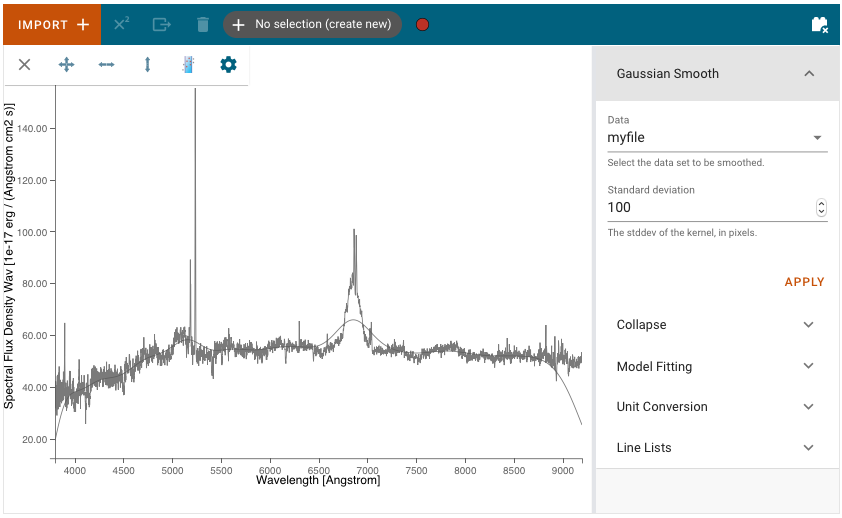
Gaussian Smooth is performed on a Spectrum1D data object. The spectrum is convolved with a Gaussian function. The Gaussian standard deviation in pixels must be entered into the Standard deviation field in the plugin.
A new Spectrum1D object is generated and is added to the spectrum viewer. It can be selected and shown in the viewer via the gear–>Data tab.
Model Fitting
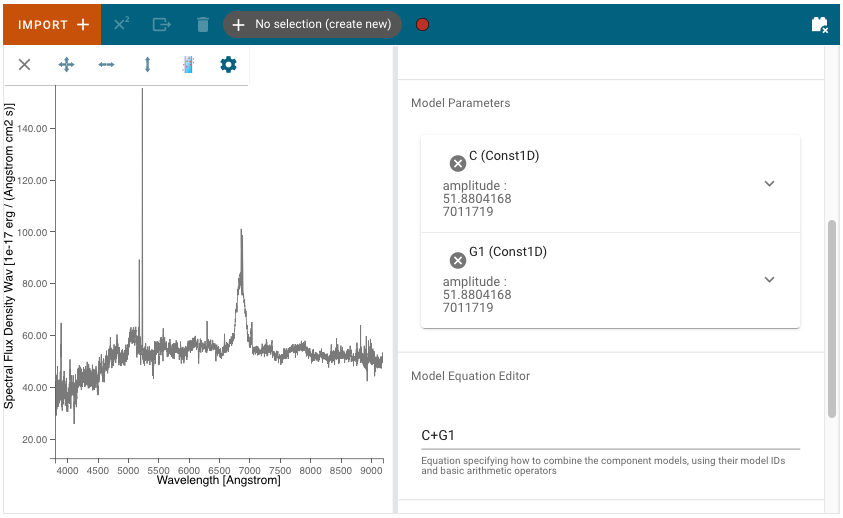
Astropy models can be fit to a spectrum via the Model Fitting plugin. Model components are selected via the Model pulldown menu. Each component should be given a Model ID. The Add Model button adds a Model Parameters block.
Model Parameters are automatically initialized with a guess. These starting values can be edited by the user. They may also be fixed by selecting the Fixed? checkbox, so that they are not fit or changed by the model fitting.
A mathematical expression must be entered into the Model Equation Editor to specify the mathematical combination of models. This is also necessary even if there is only one model component. The model components are specified by their Model ID. For example, add together Constant and Gaussian models with model IDs ‘C’ and ‘G1’ by entering the Model Equation ‘C+G1’.
Fitted models can be extracted from the app into notebook cells by using
the get_models method of the configuration helper class , e.g.
specviz.get_models(model_label="Model")
The get_models method returns the fitted astropy model objects. If only
the parameters of the model are needed, those can be extracted using the
following code:
specviz.get_model_parameters(model_label="Model")
If nothing is specified for the model_label parameter, information for
all models will be returned.
Unit Conversion
The spectral flux density and spectral axis units can be converted using the Unit Conversion plugin. The Spectrum1D object to be converted is the currently selected spectrum in the spectrum viewer gear–>Data tab.
Select the frequency, wavelength, or energy unit in the New Spectral Axis Unit pulldown (e.g. Angstrom, Hertz, erg).
Select the flux density unit in the New Flux Unit pulldown (e.g. Jansky, W/(Hz/m2), ph/(Angstrom cm2 s)).
The Apply button will convert the flux density and/or spectral axis units and create a new Spectrum1D object that is automatically switched to in the spectrum viewer. The name of the new Spectrum1D object is “_units_copy_” plus the flux and spectral units of the spectrum.
Line Lists
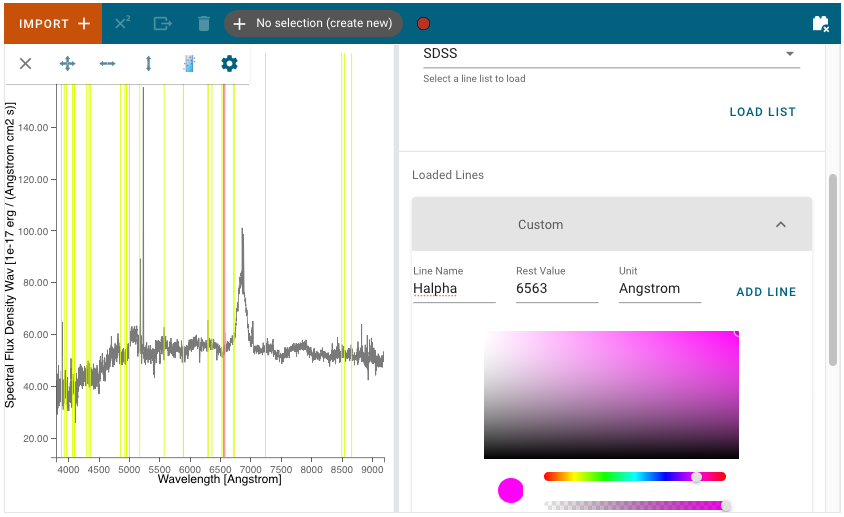
Line wavelengths can be plotted in the spectrum viewer using the Line Lists plugin.
Line lists (e.g. Common Stellar, SDSS, CO) can be selected from Preset Line Lists via the Available Line Lists pulldown. They are loaded and displayed by pressing Load List. Each loaded list is shown under Loaded Lines. Loaded line lists may be removed by pressing the circled-x button.
The Loaded Lines include a Custom line list which is automatically created, but populated with no lines. Lines may be added to the Custom line list by entering Line Name, Rest Value, and Unit for the spectral axis and pressing Add Line. Selected lines may be hidden by deselecting the associated check box.
The color of each line list may be adjusted with the color and saturation sliders. Entire line lists may be hidden in the display via Show All and Hide All, located at the bottom of each list. Similarly, all of the line lists may be shown or hidden via Plot All and Erase All, located at the bottom of the plugin.
Line Analysis
The Line Analysis plugin returns statistics for a single spectral line. The line is selected via the region tool in the spectrum viewer to select a spectral subset. Note that you can have multiple subsets in Specviz, but the plugin will only show statistics for the selected subset.
The statistics returned include the line centroid, gaussian sigma width, gaussian FWHM, total flux, and equivalent width.
No continuum operations are performed as part of this plugin. This means that
the statistics may or may not be correct depending on how you have prepared
your spectrum - most statistics assume a continuum-subtracted spectrum, aside
from equivalent width which assumes continuum-normalized. If your continuum is
not in this form initially, you may wish to either use the specutils API in
the Notebook Interface to perform continuum subtraction/normalization, or
make use of the model fitting plugin to do the appropriate corrections.