Setting Redshift/RV
Warning
Using the redshift slider with many active spectral lines can be slow, as every line gets replotted at each slider position. We recommended using the slider with no more than around a dozen lines plotted. You can deselect lines using e.g. the “Hide All” button in the line lists UI.
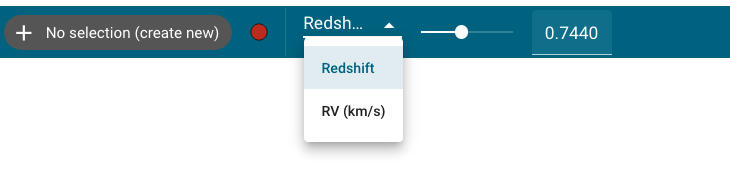
In the Specviz configuration, the toolbar includes a slider that can be used
to set an app-level redshift or radial velocity. The user can toggle between
the two modes by clicking the dropdown menu to the left of the slider bar.
Any redshift or radial velocity set by the slider bar is automatically applied
to any spectral lines that have been loaded into the app (see
Line Lists), and are applied to spectra output using the
Specviz get_spectra helper method. Note that using the lower-level app data
retrieval (e.g. specviz.app.get_data_from_viewer) will return the data as
originally loaded, with the redshift unchanged.
The default range of the slider is set from 0 to 0.5. In addition to dragging the slider left and right, the redshift can also be changed by typing a value into the box to the right of the slider. In the case that the entered value is outside the current bounds of the slider, the bounds will be updated to place the input value at the center of the range.
The slider value is also automatically updated if a spectrum is loaded that already has a redshift set.
From the notebook
The upper and lower bounds of the slider, as well as the resolution of a single
step in the slider, can be set from a notebook cell using the
set_redshift_slider_bounds method by specifying the upper, lower and
step keywords. The redshift on the slider can be set from the notebook using
the set_redshift method.