
Data Analysis Plugins#
Note
This is the config-specific version of documentation and is deprecated. See the general documentation for the most up-to-date information.
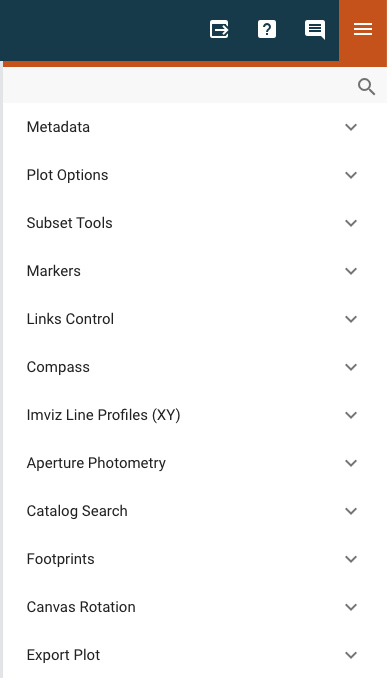
The Imviz data analysis plugins are meant to aid quick-look analysis of 2D image data. All plugins are accessed via the plugin icon in the upper right corner of the Imviz application.
Metadata Viewer#
This plugin allows viewing of any metadata associated with the selected data.
If the data is loaded from multi-extension FITS that contains a primary header, you will also see a Show primary header toggle, when enabled, would display just the primary header metadata.
Plot Options#
This plugin gives access to per-viewer and per-layer plotting options.
See also
- Display Settings
Documentation on various display settings in the Jdaviz viewers.
Data Quality#
This plugin allows you to visualize data quality arrays for science data. The currently supported data quality flag mappings include JWST (all instruments) and Roman/WFI.
Each science data layer can have one associated data quality layer. The visibility of the data quality layer can be toggled from the data dropdown menu, and toggling the science data visibility will do the same for the data quality layer. The mapping between bits and data quality flags is defined differently for each mission or instrument, and the plugin will infer the correct flag mapping from the file metadata. The opacity of the data quality layer can be changed relative to the opacity of the science data layer using the slider.
The “Quality Flag” section contains a dropdown for applying a filter to the visualized bits. Select bits from the dropdown to visualize only flags containing those bits. The list of data quality flags beneath shows every flag in the data quality layer in bold, followed by the decomposed bits in that flag in parentheses. Clicking on a row will expand to flag to reveal the flag’s short name and description, as well as a visibility toggle for that flag. Click on the color swatch to select a color for any flag.

How to load the data quality array#
The data quality array can be loaded by simply passing the appropriate extension when loading the data.
imviz = Imviz()
imviz.load('path/to/file', format='Image', ext=('SCI', 'DQ'))
imviz.show()
From the API#
If only a few of the bits are relevant to your workflow, it can be useful to hide all flags without the important bits. Say we want to see only flags containing bits zero and two. From the UI, we could select those bits in the “Filter by bits” dropdown, or from the API we could:
dq_plugin = imviz.plugins['Data Quality']
dq_plugin.flags_filter = [0, 2]
Subset Tools#
This plugin allows you to create new subsets or modify existing subsets.
To create a new subset, select Create new, and use the region selector in the spectrum viewer toolbar. You can also choose the operation that will be applied by the selector tool. Note that these are synched with the subset tools in the app-level toolbar. It might not show some static regions loaded via the API unless an interactive region is drawn after.
If an existing subset is selected, the parameters of the subset will also be
shown. Note that in addition to parameters for compound regions (e.g., a subset with
multiple disjoint regions) being displayed, the logical operations joining them
(OR, AND, etc.) are shown as well for each region. This shows how all regions
are added together to create the subset shown in the viewer.
In Imviz only, you can choose to recenter the viewer on a single subset
or group of subsets. To switch to multiselect mode, click the icon in the
top right of the plugin and select multiple subsets from the drop-down menu.
The centroid is calculated by photutils.aperture.ApertureStats.centroid,
which is the center-of-mass of the data within the aperture.
No background subtraction is performed. Click Recenter
to change its parameters and move it to the calculated centroid.
This may take multiple iterations to converge.
Note
If you want accurate centroid calculations, it is recommended that you
use a background-subtracted image. Alternately, you could calculate
the centroid outside of Jdaviz (e.g., using photutils) and then
manually edit the subset (see below) or load your own aperture object
(Importing regions via the API).
For a simple subset, you can edit its parameters by changing the values in the corresponding editable text fields. Once you have entered the new value(s), click Update to apply. You should see the subset parameters, shape, and orientation (if applicable) as all update concurrently.
Note, angle is reported in degrees as a counter-clockwise rotation about the center.
From the API#
You can update the attributes of an existing subset via the Subset Tools plugin API. To
see what attributes are available for a given subset, call the update_subset method
with only the subset specified:
st = imviz.plugins['Subset Tools']
st.update_subset(subset_label='Subset 1')
This will return a dictionary with the name (as displayed in the UI), attribute, and
value for each editable attribute of each subregion of the specified subset. Note that
passing subset_label in the update_subset call will also set the selected subset
in the plugin UI to the specified subset. If subset_label is not specified,
update_subset will operate on the currently selected subset in the plugin.
The attributes returned by the call above can be updated by passing their new
values as keyword arguments, for example:
st.update_subset(subset_label='Subset 1', xmin=10, xmax = 20)
In the case of a compound subset, the subregion to update must be specified as well:
st.update_subset(subset_label='Subset 1', subregion=0, xmin=10, xmax = 20)
Note
This is a new behavior introduced in version 4.3.
You can also create a new subset using the import_region method. This method takes a
region and either creates a new subset with that region or appends it to another subset
using the edit_subset and combination_mode arguments. for example:
st.import_region(CirclePixelRegion(center=PixCoord(x=4.5, y=4.5), radius=4.5))
will create a new subset but
st.import_region(CirclePixelRegion(center=PixCoord(x=4.5, y=4.5), radius=4.5), edit_subset='Subset 1',
 combination_mode='or')
will append the region to the existing Subset 1 using the ‘or’ combination_mode.
Other options for combination_mode include “and”, “andnot”, “new”, “replace”, and “xor”.
If you set a value for edit_subset but not combination_mode, the assumption will be
that the new region is replacing the existing subset named in edit_subset.
This API method acts independently of the UI so all settings from before import_region
was called will be restored afterward.
Markers#
This plugin allows for interactively creating markers in any viewer and logging information about the location of that marker along with the applicable data and viewer labels into a table.
With the plugin open in the tray, mouse over any viewer and press the “m” key to log the information displayed in the app toolbar into the table. The markers remain at that fixed pixel-position in the viewer they were created (regardless of changes to the underlying data or linking, see Linking of datasets in glue) and are only visible when the plugin is opened.
In Imviz, the table also exposes columns labeled “pixel:unreliable”, “world:unreliable”, and
“value:unreliable”. These will be logged as True in cases where the information is outside
the bounds of the reference image’s WCS (noted in the mouseover display by the information showing
as grayed).
Distance Tool#
The Markers plugin also includes a tool for measuring the distance and position angle between two points in a viewer. This functionality is available whenever the Markers plugin is open.
Mouse over the desired start point in a viewer and press the
dkey. A...indicator will appear in the Last Measured Distance field at the bottom of the plugin, showing that the first point is set.Mouse over the desired end point and press the
dkey again.
This will draw a line between the two points. A label showing the distance will appear, rotated to be parallel with the line, and offset to prevent intersecting the line.
A new table, Measurements, will also appear below the main markers table. This table logs the start and end coordinates (both pixel and world, if available), the on-sky separation, the pixel distance, and the position angle for each measurement.
Additional Features:
Snapping: To measure the distance from or to an existing marker, hold down the
Altkey (orOptionon Mac) when you pressd. The tool will “snap” to the nearest marker already in the main table.Clearing: Pressing the
rkey will clear all markers from the main table and all distance lines from the viewers.
From the API#
To export the table into the notebook via the API:
markersplugin = imviz.plugins['Markers']
markersplugin.export_table()
Orientation#
Note
This plugin was previous called “Links Control”.
This plugin is used to align image layers by pixels or sky (WCS). All images are automatically linked by pixels on load but you can use it to re-link by pixels or WCS as needed.
For WCS linking, the “fast approximation” option uses an affine transform to represent the offset between images, if possible. This method, although less accurate, is much more performant and should still be accurate to within a pixel for most cases. If approximation fails, WCS linking will fall back to the full transformation.
Since Jdaviz v3.9, when linking by WCS, a hidden reference data layer without distortion (labeled “Default orientation”) will be created and all the data would be linked to it instead of the first loaded data. As a result, working in pixel space when linked by WCS is not recommended. Additionally, any data with distorted WCS would show as distorted on the display. Furthermore, any data without WCS can no longer be shown in WCS linking mode.
For the best experience, it is recommended that you decide what kind of link you want and set it at the beginning of your Imviz session, rather than later.
For more details on linking, see Linking of datasets in glue.
From the API#
From the API within the Jupyter notebook (if linking by WCS):
imviz.link_data(align_by='wcs')
Orientation: Image Rotation#
When linked by WCS, sky rotation is also possible. You can choose from presets (N-up, E-left/right) or provide your own sky angle.
Warning
Each rotation request creates a new reference data layer in the background. Just as in Importing Data into Imviz, the performance would be impacted by the number of active rotation layers you have; only keep the desired rotation layer. Note that the “default orientation” layer cannot be removed.
Compass#
For an image with a valid WCS, the compass will show directions to North (N) and East (E) for ICRS sky coordinates. It also shows the currently displayed data label, the X and Y directions, and the zoom box.
When you have multiple viewers created in Imviz, use the Viewer dropdown menu to change the active viewer that it tracks.
Image Profiles (XY)#
This plugin plots line profiles across X and Y. The plugin can be activated by either:
pressing l at the desired pixel location on the image viewer, or by manually
specifying the pixel coordinates X and Y, before selecting the PLOT button.
The top visible image, the same one displayed under Compass,
will be used for these plots.
This plugin only considers pixel locations, not sky coordinates.
Aperture Photometry#
Warning
Regardless of your workflow, any WCS distortion in an image is ignored.
This plugin performs simple aperture photometry and plots a radial profile for one object within an interactively selected region. A typical workflow is as follows:
Load image(s) in Imviz (see Importing Data into Imviz).
Draw a region over the object of interest (see Defining Spatial Regions).
Select the desired image using the Data dropdown menu.
Select the desired region using the Subset dropdown menu. You can use the Subset Tools plugin to center it first on the object of interest using its center of mass, if you wish. Depending on the object, it may take several iterations for re-centering to converge, or it may never converge at all.
Note
You cannot use annulus region as aperture (an exception will be thrown) but you may use it for background (see below).
If you would like to subtract background before performing photometry, you have the following options:
Manual: Enter the background value in the Background value field. This value must be in the same unit as display data, if applicable.
Subset: Define a region for background calculation (median) using Subset draw tool and select that region using the Background dropdown menu. Only regions created with the replace option are acceptable as background regions (see Defining Spatial Regions).
If your image is already background subtracted, choose “Manual” and set the Background value to 0.
For some JWST and HST images, pixel area in arcsec2 is automatically populated in the Pixel area field from image metadata. If it does not auto-populate for you, you can manually enter a value but it must be in the unit of arcsec2. This field is only used if “per steradian” is detected in display data unit. Otherwise, it is solely informational. If this field is not applicable for you, leave it at 0. This field resets every time Data selection changes if auto-population is not possible.
Warning
If your data is in surface brightness units and pixels on the image have varying sky area, you should first convert your data from surface brightness to flux units before using this plugin. This is because, for performance reasons, the plugin multiplies by the area after the aperture sum is calculated.
If you also want your photometry result in the unit of counts, you can enter a conversion factor in the Counts conversion factor field. The value must be in the unit of display data unit per counts. This is used to convert linear flux unit (e.g., MJy/sr) to counts. This field is only used if data has a valid unit. If this field is not applicable for you, leave it at 0. This field resets every time Data selection changes.
If you also want your photometry result in magnitude units, you can enter a flux scaling factor in the Flux scaling field. Flux scaling is populated for JWST images if MJy/sr data unit is detected and pixel area is given to factor out the per-steradian unit. The value used, if this is the case, is the scaling to convert MJy to AB magnitude. Otherwise, the value must be in the same unit as display data unit. A magnitude is then calculated using $-2.5 * text{log}(text{flux} / text{flux_scaling})$. This calculation only makes sense if your display data unit is already in linear flux unit. Setting this to 1 is equivalent to no scaling. This field is only used if data has a valid unit. If this field is not applicable for you, leave it at 0. This field resets every time Data selection changes.
Select the desired radial profile plot type using the Plot Type dropdown menu (see Radial Profiles (photutils.profiles) for more details):
Curve of Growth
Radial Profile
Radial Profile (Raw)
Toggle Fit Gaussian on to fit a
Gaussian1Dmodel to the radial profile data. This is disabled for curve-of-growth.Once all inputs are populated correctly, click on the CALCULATE button to perform simple aperture photometry.
Note
The shape you see drawn from Defining Spatial Regions is not
exactly the aperture mask being used by photutils. This is because
photutils uses fractional pixels and this is not reflected in the display.
Masking and weights by uncertainty are currently not supported. However, if NaN exists in data, it will be treated as 0.
When calculation is complete, a plot would show the radial profile of the background subtracted data and the photometry and model fitting (if requested) results are displayed under the CALCULATE button.
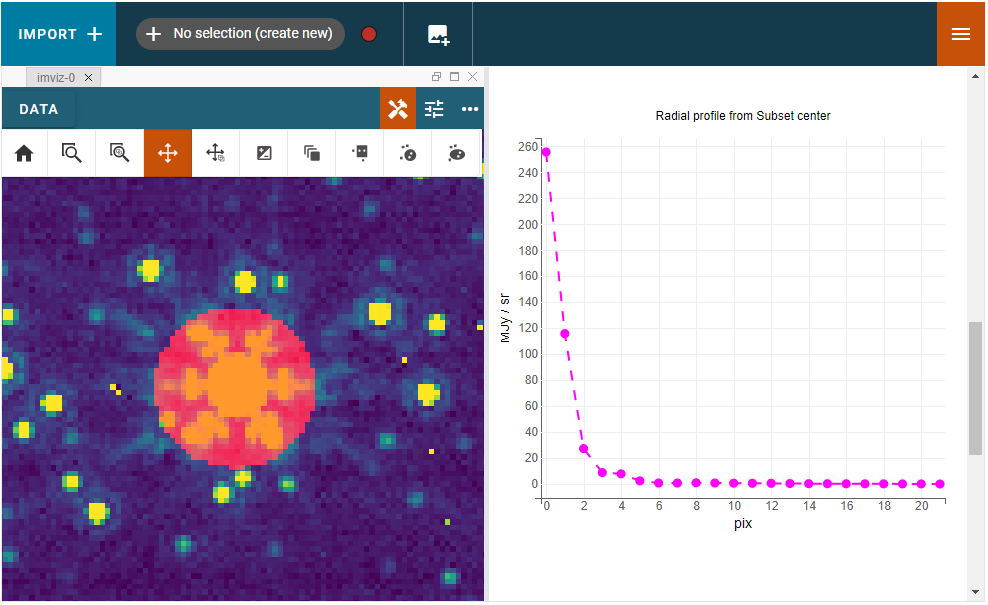
Radial profile.#
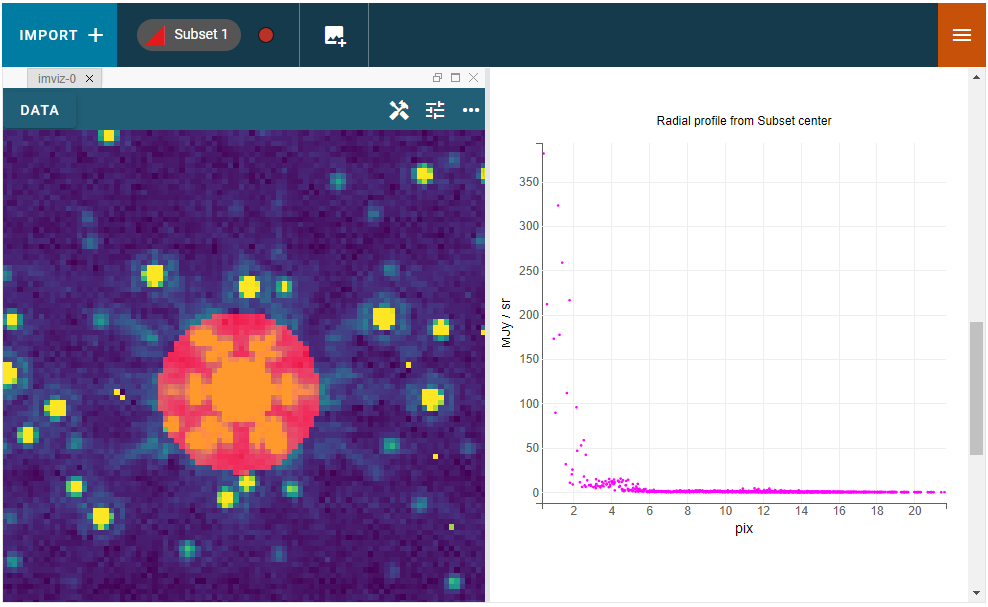
Radial profile (raw).#
See also
- Export Photometry
Documentation on exporting photometry results.
Catalog Search#
This plugin queries a catalog around the zoom window of the active image, marks the sources from the results of the query, and provides the number of sources found. After zooming into a specific region of the image, the query uses the center point of the region with a radius determined by the farthest edge point of the region. Clicking on CLEAR will remove all markers on the active viewer.
To select which catalog you would like to use for the search, please pick one of the available options from the catalog dropdown menu.
Note
This plugin is still under active development. As a result, the search only uses the SDSS DR17 catalog and the Gaia catalog and works best when you only have a single image loaded in a viewer.
To load a catalog from a supported JWST ECSV catalog file,
choose “From File…” from the menu.
The file must be parseable by astropy.table.Table.read and must contain either the sky_centroid column, or Right Ascension and Declination columns:
'sky_centroid'(Optional): Column withSkyCoordsky coordinates of the sources.'Right Ascension & Declination'(Optional): Two separate columns giving the sky coordinates in degrees, typically labeled Right Ascension (degrees) and Declination (degrees) (or simply ra/RA and dec/DEC).'label'(Optional): Column with string identifiers of the sources. If not provided, unique string identifiers will be generated automatically. If you have numerical identifiers, they will be recast as strings.
Alternately, if you already have the table object, you could load it in directly via API:
imviz.plugins["Catalog Search"].import_catalog(table_object)
Clicking SEARCH will show markers for any entry within the filtered zoom window.
If you have multiple viewers open, you will see another dropdown menu to select the active viewer.
Additionally, the query starts anew every time SEARCH is clicked, so previous results and marks are not stored. To save the current result before submitting a new query, you can save the table to a variable:
results = imviz.plugins["Catalog Search"].export_table()
Note
The table returned from the API above may cover more sources than shown in the currently zoomed-in portion of the image. Additional steps will be needed to filter out these points, if necessary.
Performing a search populates a table that contains the right ascension, declination, and the object ID of the found sources. Checkboxes next to the rows can be selected and the corresponding marks in the viewer will change to orange circles. When Zoom to Selected, the viewer will zoom to encompass the selected rows in the table.
Footprints#
This plugin supports loading and overplotting instrument footprint overlays on the image viewers.
Any number of overlays can be plotted simultaneously from any number of the available
preset instruments (requires pysiaf to be installed), by loading an Astropy regions object from
a file, or by passing an STC-S string.
The top dropdown allows renaming, adding, and removing footprint overlays. To modify the display and input parameters for a given overlay, select the overlay in the dropdown, and modify the choices in the plugin to change its color, opacity, visibilities in any image viewer in the app. You can also select between various preset instruments and change the input options (position on the sky, position angle, offsets, etc).
To import a file, open the “Import” section at the top of the dropdown and select a valid file (must
be able to be parsed by regions.Regions.read) from the applicable source.
To import a regions file, object, or STC-S string from the API:
fp = imviz.plugins['Footprints']
fp.open_in_tray()
fp.add_overlay('my imported overlay')  # or fp.rename_overlay to rename an existing entry
fp.import_region(region)
Export#
This plugin allows exporting:
the plot in a given viewer to a PNG or SVG file,
a table in a plugin to ecsv
subsets as a region to .fits or .reg file.