
Displaying Images#
Note
This is the config-specific version of documentation and is deprecated. See the general documentation for the most up-to-date information.
Imviz uses image viewers to visualize data from supported formats. Much of the functionality is available both from the application GUI and from the Jupyter notebook using API calls. The Toolbar below gives you several image display options. Right-click will open a dropdown with access to different options for each button.

Selecting a Data Set#
Data can be selected and de-selected in each viewer’s data menu, opened by clicking on the legend in the top right of the viewer. Here, all the data and subset layers are listed and their visibility can be toggled with the “eye” icon on the right.

To add an additional data layer or interactively create a new subset, click the “+” icon in the top right of the data menu. The datasets available in each viewer are filtered to include only compatible data, so you may not see all loaded data in the menu for every viewer. For example, 1D spectra will not be available in the image viewers.
Clicking on the rows in the data menu selects entries for further actions available in the bottom bar of the data menu. Here you can modify selected subsets, view metadata or subset details, or remove layers from either the viewer or the entire application instance.
Warning
Deleting the first image that was loaded into Imviz may be slow, as deleting this image requires Imviz to re-link any remaining data together and redefine any existing subsets.
Cursor Information#
By moving your cursor along the image viewer, you will be able to see information on the cursor’s location in pixel space (X and Y), the RA and Dec at that point, and the value of the data there. This information is displayed in the top bar of the UI, on the middle-right side.
By default, the cursor information will correspond to the top image layer in the viewer. To change to a specific data-layer, click the layer-icon in the top bar to cycle between “auto”, “cursor”, or specific data layers.
Notes on GWCS#
If your reference data has GWCS with a bounding box, any coordinates transformation
outside that bounding box is less reliable. This still applies even when you are
looking at some other data that is not the reference data if they are linked by WCS
because all transformations in glue go through the reference data. Such a situation
is indicated by the affected coordinates becoming gray.
If your data of interest also has a GWCS with a bounding box, only the mouseover data inside the bounding box is completely reliable. Unreliable coordinates transformation here will also be hidden or grayed out in a similar fashion as above.
To avoid inaccurate transforms, consider one of the following workflows:
Make sure your reference data’s GWCS has a bounding box that encompasses all the other data you are trying to visualize together.
If the above is not possible, avoid overlaying different data with GWCS that do not overlap.
Warning
If you rely on the GWCS bounding box, it will be set to None when
you data is loaded into Imviz, but the original bounding box,
if available, is now in a hidden _orig_bounding_box
attribute of the GWCS object. You can restore the bounding box by
assigning the value of _orig_bounding_box back to its
bounding_box attribute.
Note that FITS WCS has no similar concept of bounding box.
Home#
This button will reset your zoom and panning to display the entire image.
Previous zoom is also available by right-clicking on the home icon and selecting the previous zoom icon. This will revert to the last saved zoom state. Zoom states are saved when beginning a zoom selection or when activating a pan/zoom tool.
Box Zoom and Linked Box Zoom#
Linked Box Zoom is an Imviz-specific feature enabled only when there are multiple viewers that allows the user to zoom images in multiple different viewers simultaneously, not unlike Pan/Zoom and Linked Pan/Zoom.
Single-viewer Box Zoom is also available and is used in a similar way as in other Jdaviz tools. To access this option when there are multiple viewers, right-click on the Linked Box Zoom button and left-click on the second option down to select it.
Pan/Zoom and Linked Pan/Zoom#
Linked Pan/Zoom is an Imviz-specific feature enabled only when there are multiple viewers that allows the user to pan and zoom images in multiple different viewers simultaneously. This works by matching images based on the way they are linked together. Images are linked by pixels on load time, but you can re-link them via WCS using Orientation.
Single-viewer Pan/Zoom is also available and is used in a similar way as in other Jdaviz tools. To access this option when there are multiple viewers, right-click on the Linked Pan/Zoom button and left-click on the second option down to select it.
When in either of these modes, clicking on the image will recenter the image to the location under cursor.
From the API#
From the API, you can programmatically zoom in and out. Zoom level:
1 - real-pixel-size
2 - zoomed in by a factor of 2
0.5 - zoomed out by a factor of 2
'fit'- zoomed to fit the whole image width into display
For example:
viewer = imviz.default_viewer
viewer.zoom_level
viewer.zoom_level = 1  # Set the zoom level directly.
viewer.zoom(2)  # Set the relative zoom based on current zoom level.
Defining Spatial Regions#
Spatial regions allow users to select subsets of the data array for use in specific analysis functions in the plugin toolbar, for example in the Aperture Photometry plugin. Users can create spatial regions either in Imviz or the Jupyter notebook.
Regions can be created by first clicking the ![]() icon (to draw a circular region),
then clicking and dragging (using the mouse) until the
desired region is covered by a colored shape, after which you release the mouse button.
If you want to draw other shapes, right click on the icon to see a dropdown of supported shapes
and left click on it to choose the shape, then draw as mentioned above.
icon (to draw a circular region),
then clicking and dragging (using the mouse) until the
desired region is covered by a colored shape, after which you release the mouse button.
If you want to draw other shapes, right click on the icon to see a dropdown of supported shapes
and left click on it to choose the shape, then draw as mentioned above.
Once you have completed the action of clicking and dragging, there is an opportunity to reposition the region of interest by clicking on it and moving the region to a different location in the image viewer. If you are satisfied with the positioning of your region of interest, simply click another part of the viewer to lock it in place.
There are other options available for region of interest. At the top of the user interface, there is a section that says either “+ No selection (create new)” or “Subset n” where n is an integer that tells you which Subset is currently selected. Red circles to the right of this area allow you to change the method of region selection. The options are:
replace: will remove the previously created selection and place the newly created subset.add: allows you to create another subset that extends the existing subset.and: only leaves behind the overlapping region between the existing subset and any additional subsets.xor: only leaves behind the non-overlapping region between the existing subset and any additional subsets.remove: will de-select any parts of the existing subset that overlaps with any additional subsets.
You can use these options to further adjust the region of interest and adapt it to your use case.
See also
- Importing Spatial Regions
Importing regions from within the Jupyter notebook.
See also
- Exporting Spatial Regions
Exporting regions from within the Jupyter notebook.
See also
- Defining subsets using glue
Glueviz documentation on defining and refining subsets. Slightly different UI but same approach.
There are options available in the Layer tab under the ![]() icon
to make subsets visible or invisible, to change their color, and to change their opacity.
icon
to make subsets visible or invisible, to change their color, and to change their opacity.
Single-Pixel Selection#
This tool is no longer available as of Jdaviz v3.9; use the Markers plugin instead.
Blinking#
Blinking is an Imviz-specific functionality that allows a user to quickly switch
between viewing two or more images, as long as they are linked (see Pan/Zoom and Linked Pan/Zoom for
more on linking behavior). This can be done by selecting the ![]() icon (only available if
there are more than one image loaded in the viewer) and then left-clicking on the image to blink
forward; right-clicking to blink backwards.
icon (only available if
there are more than one image loaded in the viewer) and then left-clicking on the image to blink
forward; right-clicking to blink backwards.
You can also blink forward by pressing the “b” key on your keyboard while moused over the image. If you press Shift + “b” (“B”), you may blink backwards.
From the API#
From the API within the Jupyter notebook:
viewer = imviz.default_viewer
viewer.blink_once()
And to blink backwards:
viewer.blink_once(reversed=True)
Contrast/Bias#
In addition to changing Contrast and Bias in the Display Settings,
Imviz has a ![]() button under the
button under the ![]() menu that can also
adjust those values.
menu that can also
adjust those values.
After right-clicking on the blink icon, left click on the constrast/bias icon to activate it. Now you can click and drag on the image viewer to change the contrast and bias. Moving along the X-axis will change the bias and moving along the Y-axis will change the contrast. If you would like to reset to the default contrast and bias settings, you can double-click on the display while the mode is active.
Display Settings#
To access all of the different display settings for an image viewer, click the
![]() icon in the viewer toolbar or open the Plot Options plugin.
Changing the display settings does not change the underlying data, only the
visualization of that data.
icon in the viewer toolbar or open the Plot Options plugin.
Changing the display settings does not change the underlying data, only the
visualization of that data.
If you wish to access plot options via API
(also see PlotOptions),
you can use the following generic example. More specific examples are given
later in this Section.
plot_options = imviz.plugins['Plot Options']
plot_options.layer = 'my file'
plot_options.image_colormap = 'Plasma'
plot_options.stretch_function = 'Arcsinh'
plot_options.stretch_vmin = 0.05
plot_options.stretch_vmax = 1.0
Layer#
This option allows you to choose the layer for which you are changing the settings.
Show image#
This option selects whether to show or hide the image in the viewer.
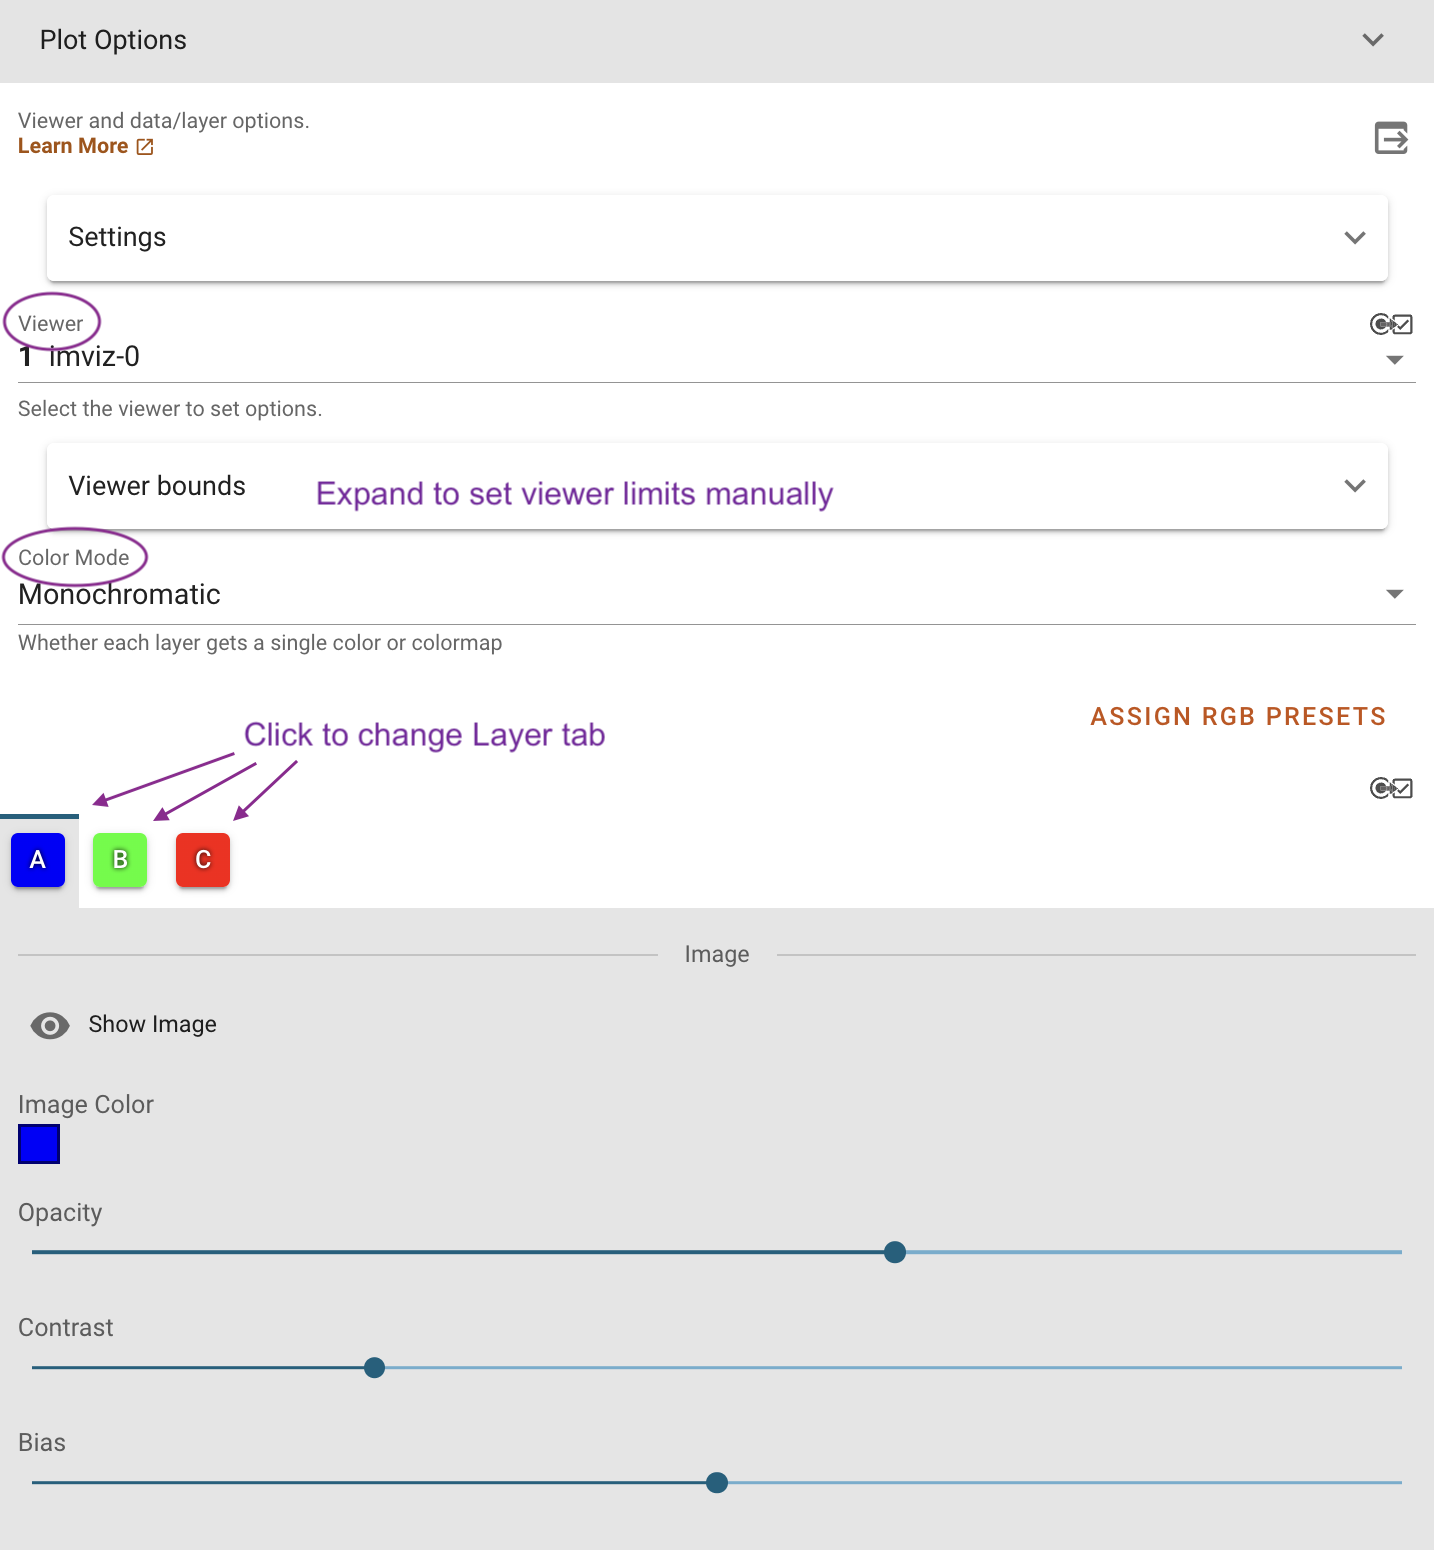
Color mode#
This option allows you to choose whether to use a colormap or or a single color to visualize the image. The colormap can be selected from a dropdown within the Layer tab.
In “Color” mode, the color can be chosen from a color picker under “Image Color” within the Layer tab. The option “Assign RGB presets” also appears. This will automatically assign colors (spanning from blue to red) to the available layers and will adjust opacity and stretch to produce a composite color image (also known as an RGB image). You will then be able to fine tune all options within each Layer tab.
From the API#
The colormap for just the image being displayed can be set using the Astrowidgets API:
viewer = imviz.default_viewer
viewer.colormap_options
viewer.set_colormap('Viridis')
Or it can be set using the Plugin API (in this example, the colormap is being set for all the images at once):
plot_options = imviz.plugins['Plot Options']
plot_options.select_all()
plot_options.image_colormap = 'Viridis'
Adding Custom Colormap#
A custom colormap can only be added when Imviz is run in a notebook, not from the
command line. The custom colormap must be added to glue before starting Imviz.
The example below adds a random colormap generated by photutils into glue:
from glue.config import colormaps
from photutils.utils import make_random_cmap

randcmap = make_random_cmap(n_colors=256)
randcmap.colors[0] = 0.  # To make your background black
colormaps.add('photutils_cmap', randcmap)
Only after the above is done can you start Imviz and use the custom colormap:
imviz = Imviz()
imviz.load('myimage.fits', format='Image')
imviz.default_viewer.set_colormap('photutils_cmap')
Opacity#
Change the translucence of the image.
Contrast#
Change the luminance of the color in the image.
Bias#
Set a constant to subtract from every point in the data array before applying the conversion between data value and displayed pixel saturation. The bias slider center position is 0 bias, such that a user can apply negative bias values by sliding it left.
Stretch#
The Stretch Function
(see Image stretching and normalization)
allows you to change the equation that is used to convert data values between
min and max to the 0 to 1 scale of pixel saturation on the
image. The “Stretch Percentile Preset” can be used to set the min and max
values based on percentiles of the data.
An interactive histogram is available. It shows vertical lines representing
the stretch_vmin and stretch_vmax values, and a colorbar on top.
The stretch “curve” is plotted on the histogram to represent
how pixel values are mapped to the colorbar and can be toggled on and off in the plugin.
The collapsed menu “More Stretch Options”
includes a toggle to limit the histogram to the current zoom limits (which is not on by default)
and fields to set min and max manually.
From the API#
The stretch function for just the image being displayed
(the acceptable values are as defined by glue backend) can be set using
the Astrowidgets API:
viewer = imviz.default_viewer
viewer.stretch_options
viewer.stretch = 'sqrt'
Or it can be set using the Plugin API for a single image or all the images at once
(the acceptable values are the same as the GUI menu options
and can be accessed with plot_options.stretch_function.choices):
plot_options = imviz.plugins['Plot Options']
plot_options.select_all()
plot_options.stretch_function = 'Square Root'
The stretch curve on the histogram can also be toggled using the Plugin API:
plot_options = imviz.plugins['Plot Options']
plot_options.stretch_curve_visible = True
The percentile for just the image being displayed can be set using the Astrowidgets API:
viewer = imviz.default_viewer
viewer.cuts = '95%'  # Preset
viewer.cuts = (0, 1000)  # Custom
Or it can be set using the Plugin API for one image or all the images at once:
plot_options = imviz.plugins['Plot Options']
plot_options.select_all()

# Preset
plot_options.stretch_preset = '95%'

# Custom
plot_options.stretch_preset = 'Custom'
plot_options.stretch_vmin = 0
plot_options.stretch_vmax = 1000
Contour#
This option selects whether to show or hide contours. It is off by default and can be turned on by clicking the eye icon. The Contours of a second image can be plotted over a first image or cube. The contours of the second image will appear superimposed on the first image. If contours are overplotted on a cube, the contours will remain unchanged as you scrub through the cube. Please note that this feature is in development and will be improved in the future.
Adding New Viewers#
In the toolbar towards the top of the UI, there is a ![]() icon
that when clicked will add new viewers to the application. You can then select from the data
that has been loaded into the application to be visualized in these additional viewers.
You can then utilize some of the Imviz-specific features, like Pan/Zoom and Linked Pan/Zoom.
icon
that when clicked will add new viewers to the application. You can then select from the data
that has been loaded into the application to be visualized in these additional viewers.
You can then utilize some of the Imviz-specific features, like Pan/Zoom and Linked Pan/Zoom.
From the API#
From the API within the Jupyter notebook:
viewer_2_name = 'Window 2'
viewer_2 = imviz.create_image_viewer(viewer_name=viewer_2_name)
imviz._app.add_data_to_viewer(viewer_2_name, 'MyImportedData')
where 'MyImportedData' is a data set that has already been imported into Imviz.